- Splunk Answers
- :
- Using Splunk
- :
- Splunk Search
- :
- How do I separate each IP and corresponding time f...
- Subscribe to RSS Feed
- Mark Topic as New
- Mark Topic as Read
- Float this Topic for Current User
- Bookmark Topic
- Subscribe to Topic
- Mute Topic
- Printer Friendly Page
- Mark as New
- Bookmark Message
- Subscribe to Message
- Mute Message
- Subscribe to RSS Feed
- Permalink
- Report Inappropriate Content
Hey guys.
I have events like this "ip delay|" every second:
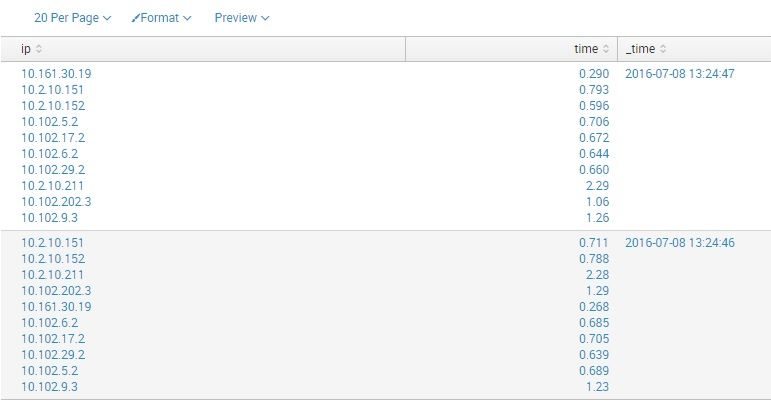
10.161.30.19 0.290|10.2.10.151 0.793|10.2.10.152 0.596|10.102.5.2 0.706|10.102.17.2 0.672|10.102.6.2 0.644|10.102.29.2 0.660|10.2.10.211 2.29|10.102.202.3 1.06|10.102.9.3 1.26|
I tried:
index="ping" | rex max_match=100 field=_raw "(?(\d{1,3}\.){3}\d{1,3})\s(?(\d+\.?\d+))" | table ip time _time
and see
So I can't make right timechart like:
| timechart avg(time) by host
because average time in one event is the same for all IPs, I need to separate each one into separate events to find the average.
- Mark as New
- Bookmark Message
- Subscribe to Message
- Mute Message
- Subscribe to RSS Feed
- Permalink
- Report Inappropriate Content
This should do it
index="ping" | rex max_match=100 field=_raw "(?<temp>(\d{1,3}.){3}\d{1,3}\s\d+.?\d+)" | table _time temp | mvexpand temp
| rex field=temp "(?<ip>(\d{1,3}.){3}\d{1,3})\s(?<time>(\d+.?\d+))"  | timechart avg(time) by ip limit=0
- Mark as New
- Bookmark Message
- Subscribe to Message
- Mute Message
- Subscribe to RSS Feed
- Permalink
- Report Inappropriate Content
index="ping" | rex max_match=100 field=_raw "(?(\d{1,3}.){3}\d{1,3}\s\d+.?\d+)" | table _time temp | mvexpand temp
| rex field=temp "(?(\d{1,3}.){3}\d{1,3})\s(?(\d+.?\d+))" | timechart avg(time) by ip limit=0
- Mark as New
- Bookmark Message
- Subscribe to Message
- Mute Message
- Subscribe to RSS Feed
- Permalink
- Report Inappropriate Content
This should do it
index="ping" | rex max_match=100 field=_raw "(?<temp>(\d{1,3}.){3}\d{1,3}\s\d+.?\d+)" | table _time temp | mvexpand temp
| rex field=temp "(?<ip>(\d{1,3}.){3}\d{1,3})\s(?<time>(\d+.?\d+))"  | timechart avg(time) by ip limit=0
- Mark as New
- Bookmark Message
- Subscribe to Message
- Mute Message
- Subscribe to RSS Feed
- Permalink
- Report Inappropriate Content
how about this:
| rex max_match=100 field=_raw "(?<ip>(\d{1,3}.){3}\d{1,3})\s(?<time>(\d+.?\d+))"
| mvexpand ip
| mvexpand time
| table ip time
Which then works with timechart:
| rex max_match=100 field=_raw "(?<ip>(\d{1,3}.){3}\d{1,3})\s(?<time>(\d+.?\d+))"
| mvexpand ip
| mvexpand time
| timechart avg(time) by ip
http://docs.splunk.com/Documentation/Splunk/6.4.1/SearchReference/Mvexpand
- Mark as New
- Bookmark Message
- Subscribe to Message
- Mute Message
- Subscribe to RSS Feed
- Permalink
- Report Inappropriate Content
Won't this give additional rows due to two mvexpand where ip and time should be related?
| gentimes start=-1 | eval _raw="10.161.30.19 0.290|10.2.10.151 0.793" | rex max_match=100 field=_raw "(?<ip>(\d{1,3}.){3}\d{1,3})\s(?<time>(\d+.?\d+))" | mvexpand ip | mvexpand time | table ip time
Output
ip↕   time↕
10.161.30.19  0.290
10.161.30.19  0.793
10.2.10.151  0.290
10.2.10.151  0.793
Getting 4 rows instead of 2
- Mark as New
- Bookmark Message
- Subscribe to Message
- Mute Message
- Subscribe to RSS Feed
- Permalink
- Report Inappropriate Content
i need just two different event in this case
- Mark as New
- Bookmark Message
- Subscribe to Message
- Mute Message
- Subscribe to RSS Feed
- Permalink
- Report Inappropriate Content
ofcourse, event multiplies, so i have events N to N, IP to delay, not 1 to 1
- Mark as New
- Bookmark Message
- Subscribe to Message
- Mute Message
- Subscribe to RSS Feed
- Permalink
- Report Inappropriate Content
This query?
 index="ping" | rex max_match=100 field=_raw "(?<temp>(\d{1,3}.){3}\d{1,3}\s\d+.?\d+)" | table _time temp | mvexpand temp
 | rex field=temp "(?<ip>(\d{1,3}.){3}\d{1,3})\s(?<time>(\d+.?\d+))"  | timechart avg(time) by ip limit=0
- Mark as New
- Bookmark Message
- Subscribe to Message
- Mute Message
- Subscribe to RSS Feed
- Permalink
- Report Inappropriate Content
hmmm... i'm tried one more time and now all work fine, have't idea what changed.
Thanks for patience!
- Mark as New
- Bookmark Message
- Subscribe to Message
- Mute Message
- Subscribe to RSS Feed
- Permalink
- Report Inappropriate Content
Did you try the method in my answer?
- Mark as New
- Bookmark Message
- Subscribe to Message
- Mute Message
- Subscribe to RSS Feed
- Permalink
- Report Inappropriate Content
if i have two events with three IPs in each so i want to have six values.
Seems like in there no relations between IP and delay, because mvexpand make events with ALL values of delay.
i need this:
_time=1 ip=10.161.30.19 delay=0.290
_time=1 ip=10.2.10.151 delay=0.793
_time=2 ip=10.161.30.19 delay=0.320
_time=2 ip=10.2.10.151 delay=0.913
- Mark as New
- Bookmark Message
- Subscribe to Message
- Mute Message
- Subscribe to RSS Feed
- Permalink
- Report Inappropriate Content
something is wrong
msg:
t1467986795.01i10.2.10.215d4.64i10.102.33.2d0.686i10.102.16.2d0.702i10.102.4.2d24.8i10.102.34.2d0.789i10.102.54.2d0.727i10.2.10.210d6.42i10.102.101.2d0.702i10.2.10.203d0.710i10.2.10.142d0.734i10.102.109.2d0.649i10.2.10.219d2.11i10.102.104.2d0.707i10.102.103.2d0.749i10.102.108.2d0.883i10.2.10.148d0.697
| rex max_match=100 field=_raw "i(?(\d{1,3}.){3}\d{1,3})d(?(\d+.?\d+))"
| mvexpand ip
| table ip time _time
| where ip="10.2.10.207"

so i have
so this ip have all values from time and not just him own

