- Splunk Answers
- :
- Using Splunk
- :
- Splunk Search
- :
- Re: How do I make a search string to get Real Time...
- Subscribe to RSS Feed
- Mark Topic as New
- Mark Topic as Read
- Float this Topic for Current User
- Bookmark Topic
- Subscribe to Topic
- Mute Topic
- Printer Friendly Page
- Mark as New
- Bookmark Message
- Subscribe to Message
- Mute Message
- Subscribe to RSS Feed
- Permalink
- Report Inappropriate Content

I'm trying to to get data from two *.txt files into a single Line Chart.
For example, with the following string, I get the data into the Line Chart:
(host=jp) source="/home/jp/pings/targets/googledns.txt" | timechart avg(time)
But, what I am trying to do is also get data from another .txt file, at the same time:
(host=jp) source="/home/jp/pings/targets/defaultGateway.txt" | timechart avg(time)
... so in one Line Chart, it would show the data from both files.
With the following string, in Real Time, it only shows sheet1 in the Line Chart:
(host=jp) source="/home/jp/pings/targets/googledns.txt" | timechart avg(time) as sheet1 |appendcols [search (host=jp) source="/home/jp/pings/targets/defaultGateway.txt" | timechart avg(time) as sheet2]
I verified that when I change from Real Time -> 30 minute windows... to... Last 15 minutes... it shows sheet1 and sheet2.
This means that the script you provided is not for Real Time reading of data, due to it it only shows sheet1.
Could you please provide us a string that is capable to read multiple .txt files in Real Time mode?
Thank you in advance
Kind regards
JP
- Mark as New
- Bookmark Message
- Subscribe to Message
- Mute Message
- Subscribe to RSS Feed
- Permalink
- Report Inappropriate Content
How about.....
(host=jp) source="/home/jp/pings/targets/googledns.txt" OR source="/home/jp/pings/targets/defaultGateway.txt"
| timechart avg(time) by source
- Mark as New
- Bookmark Message
- Subscribe to Message
- Mute Message
- Subscribe to RSS Feed
- Permalink
- Report Inappropriate Content
How about.....
(host=jp) source="/home/jp/pings/targets/googledns.txt" OR source="/home/jp/pings/targets/defaultGateway.txt"
| timechart avg(time) by source
- Mark as New
- Bookmark Message
- Subscribe to Message
- Mute Message
- Subscribe to RSS Feed
- Permalink
- Report Inappropriate Content
One option could be to rename the fields after the averages has been calculated
 (host=jp) source="/home/jp/pings/targets/googledns.txt" OR source="/home/jp/pings/targets/defaultGateway.txt"
| timechart avg(time) by source
| rename /home/jp/pings/targets/googledns.txt as "Google DNS", /home/jp/pings/targets/defaultGateway.txt as "Default Gateway"
- Mark as New
- Bookmark Message
- Subscribe to Message
- Mute Message
- Subscribe to RSS Feed
- Permalink
- Report Inappropriate Content
Hi Misvill,
I got an error with the script you provided, but with a small change, it works:
(host=jp) source="/home/jp/pings/targets/googledns.txt" OR source="/home/jp/pings/targets/defaultGateway.txt"
| timechart avg(time) by source
| rename /home/jp/pings/targets/googledns.txt as "Google DNS" | /home/jp/pings/targets/defaultGateway.txt as "Default Gateway"
If is not asking to much....
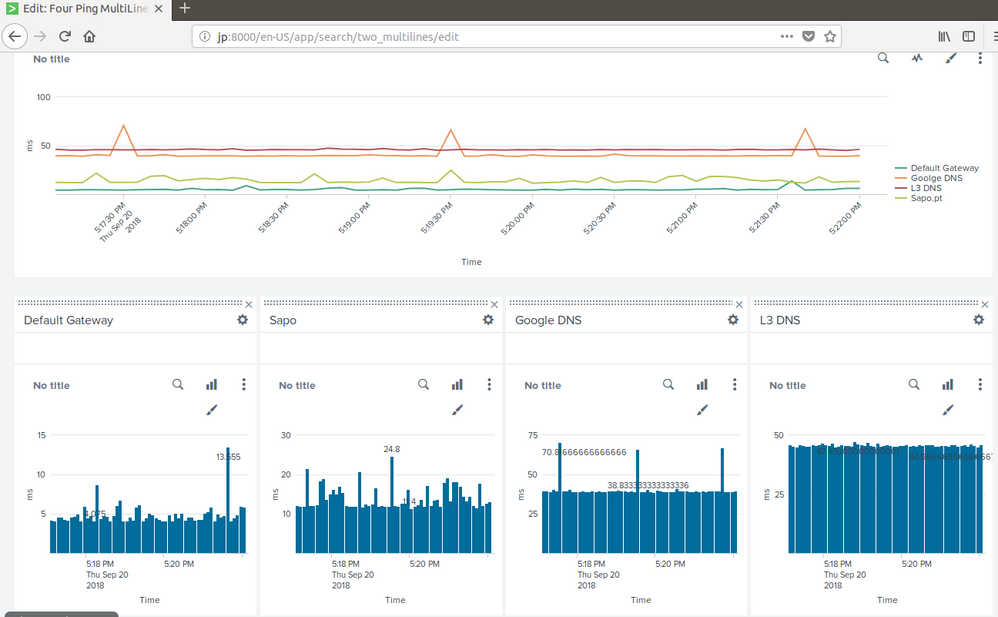
Could you please help, to get the same color in the charts, below the line chart... each one with the color of the line, in the Line Chart
Thank you for you're kind support.
Best regards
JP
- Mark as New
- Bookmark Message
- Subscribe to Message
- Mute Message
- Subscribe to RSS Feed
- Permalink
- Report Inappropriate Content
Can you please accept the answer which has been done as ask the additional question as new question?
- Mark as New
- Bookmark Message
- Subscribe to Message
- Mute Message
- Subscribe to RSS Feed
- Permalink
- Report Inappropriate Content
You haven't accepted my answer. You've accepted your own with the screenshot.
- Mark as New
- Bookmark Message
- Subscribe to Message
- Mute Message
- Subscribe to RSS Feed
- Permalink
- Report Inappropriate Content
- Mark as New
- Bookmark Message
- Subscribe to Message
- Mute Message
- Subscribe to RSS Feed
- Permalink
- Report Inappropriate Content
Hi Msivill,
Thanks a lot, now I get data into the Line Chart from the two different .txt files.
I already tested with more .txt files, reading from them a PING -t from other locations, in Real Time and works without issues.
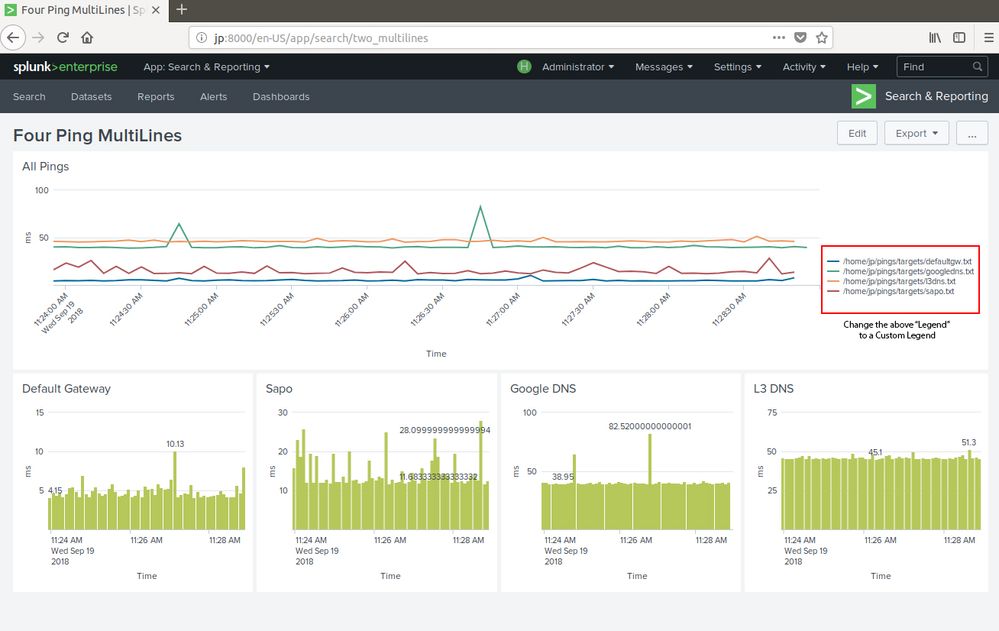
Maybe you could help, how to change the "Legend" of the two files that shows in the Line Chart, to a custom "Legend".
Thanks again.
Kind regards
JP
- Mark as New
- Bookmark Message
- Subscribe to Message
- Mute Message
- Subscribe to RSS Feed
- Permalink
- Report Inappropriate Content
Hi Msivill
I can't find here, where to upload a screenshot.
But I can send you, if you send me the contact.
Thank you in advance.
Kind regards
JP
- Mark as New
- Bookmark Message
- Subscribe to Message
- Mute Message
- Subscribe to RSS Feed
- Permalink
- Report Inappropriate Content
Can you edit the original question to add it there? It looks like I can add an image that is already up on the internet in this comment, but that won't help. A visual helps me get my head around the problem quicker. What text is currently appearing in the legend?
- Mark as New
- Bookmark Message
- Subscribe to Message
- Mute Message
- Subscribe to RSS Feed
- Permalink
- Report Inappropriate Content
Have you got a picture to show what you currently have?

