Join the Conversation
- Find Answers
- :
- Using Splunk
- :
- Splunk Search
- :
- How can I use timechart to show a chart of this se...
- Subscribe to RSS Feed
- Mark Topic as New
- Mark Topic as Read
- Float this Topic for Current User
- Bookmark Topic
- Subscribe to Topic
- Mute Topic
- Printer Friendly Page
- Mark as New
- Bookmark Message
- Subscribe to Message
- Mute Message
- Subscribe to RSS Feed
- Permalink
- Report Inappropriate Content
How can I use timechart to show a chart of this search with time on x-axis and failure% for each browser on y-axis?
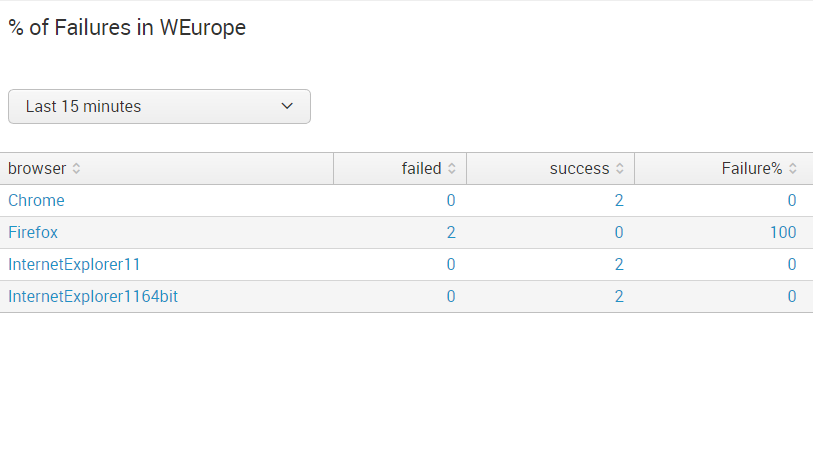
This search resulted in a table with columns, browser, failed, success, Failure%
For eg.,
browser    failed    success       Failure%
Chrome     0         2             0
Firefox    2         0             100
IE         0         2             0
IE64       0         2             0
index=... sourcetype=... | rex "(?successful|failed) for the app (?\w+) and browser (?\w+) and region (?\w+)" | where isnotnull(appname) and isnotnull(browser) and region="WEurope" | eval has_failure = if(testResult="failed",1,0) | eval has_success = if(testResult="successful",1,0) | stats sum(has_failure) as failed, sum(has_success) as success by browser | addtotals fieldname=Total | eval Failure%=100*failed/Total | table browser, failed, success, Failure%
What would be the timechart type of query that I have write to get the time on x-axis, and only failure% for each browser on y-axis?
- Mark as New
- Bookmark Message
- Subscribe to Message
- Mute Message
- Subscribe to RSS Feed
- Permalink
- Report Inappropriate Content
Let us say this very gently... to use timechart, there has to be a _time. 😉
 index=... sourcetype=...
| rex "(?<testResult>successful|failed) for the app (?<appname>\w+) and browser (?<browser>\w+) and region (?<region>\w+)"
| where isnotnull(appname) and isnotnull(browser) and region="WEurope"
| eval has_failure = if(testResult="failed",1,0)
| eval has_success = if(testResult="successful",1,0)
| bin _time span=1h
| stats sum(has_failure) as failed, sum(has_success) as success by browser _time
| addtotals fieldname=Total
| eval Failure%=100*failed/Total
| table _time browser Failure%
| timechart span=1h avg(Failure%) as Failure% by browser
You can modify your time span based on the use case, and the timechart doesn't have to be as granular as the bin is. We just set them both to 1h so that you'd have something to work with.
You'll also have to verify that we properly fixed your rex with whatever the interface deleted.
- Mark as New
- Bookmark Message
- Subscribe to Message
- Mute Message
- Subscribe to RSS Feed
- Permalink
- Report Inappropriate Content
That worked! Thank you very much!
- Mark as New
- Bookmark Message
- Subscribe to Message
- Mute Message
- Subscribe to RSS Feed
- Permalink
- Report Inappropriate Content
@sdep - We're happy to help. If your problem is solved, please accept an answer. You can always upvote any other answers that you found helpful as well (although that's not applicable here).

