- Splunk Answers
- :
- Using Splunk
- :
- Splunk Search
- :
- FEATURE REQUEST: Trellis timechart with color by f...
- Subscribe to RSS Feed
- Mark Topic as New
- Mark Topic as Read
- Float this Topic for Current User
- Bookmark Topic
- Subscribe to Topic
- Mute Topic
- Printer Friendly Page
- Mark as New
- Bookmark Message
- Subscribe to Message
- Mute Message
- Subscribe to RSS Feed
- Permalink
- Report Inappropriate Content
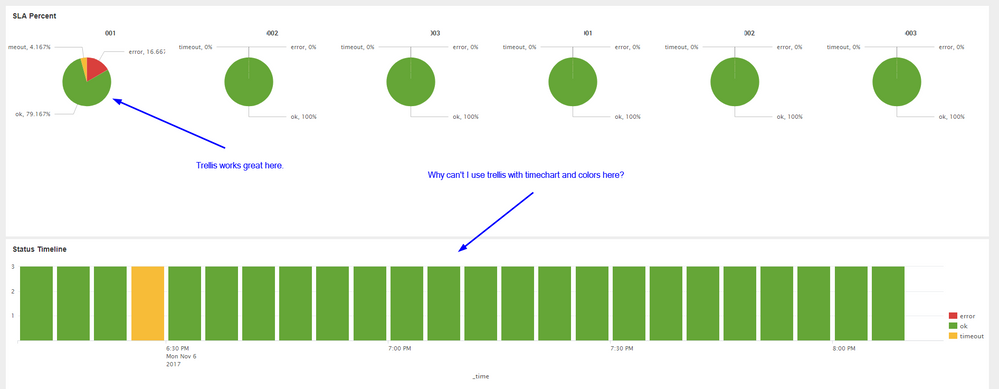
Ok, I've figured this out for pie charts, but it seems I'm not able to do this for timecharts in trellis? I'd like to color by a field (result). Here's sample query that's working for a pie chart. In the queries below, I want to color by result. (ok, error, or timeout)
This one works nicely since I can split the trellis by title and then color by result 🙂
pie chart search:
index=preview sourcetype=website_input
| rex field=source "web_input://(?<title>.+)"
| fillnull value=timeout result
| chart count by  title result
I can't use the timechart command since it only allows one split by clause 😞 otherwise this would be trivial to do.
search:
index=preview sourcetype=website_input
| rex field=source "web_input://(?<title>.+)"
| fillnull value=timeout result
| timechart count by result
ok, let's try stats. Then we can split the trellis by title and then color by result. Nope 😞 doesn't render
search:
index=preview sourcetype=website_input
| rex field=source "web_input://(?<title>.+)"
| fillnull value=timeout result
| bucket _time span=5m
| stats count by _time result title
- Mark as New
- Bookmark Message
- Subscribe to Message
- Mute Message
- Subscribe to RSS Feed
- Permalink
- Report Inappropriate Content
I think something like this should get you what you want hopefully.
index=_internal status=* sourcetype=splunk_web_access user!="-"
| eval type=case(status="200","good",status="404","bad",1=1,"other")
| timechart span=1h limit=10 useother=f  c(eval(type="good")) as good c(eval(type="bad")) as bad c(eval(type="other")) as other  by user
You should be able to run that on your instance.You should be able to trellis by user and each user will show good/bad/other items on their own timechart.
- Mark as New
- Bookmark Message
- Subscribe to Message
- Mute Message
- Subscribe to RSS Feed
- Permalink
- Report Inappropriate Content
@MattZerfas came up with this great workaround. I'm still hoping they will come out with an easy version at some point so we won't have to hard code the fields, but this will definitely work for the dashboards where I have a very static values for these fields.
and my updated query:
index=preview sourcetype=website_input
| rex field=source "web_input://(?<title>.+)"
| fillnull value=timeout result
| timechart partial=f span=5m limit=10 useother=f c(eval(result="ok")) as ok c(eval(result="timeout")) as timeout c(eval(result="error")) as error by title
- Mark as New
- Bookmark Message
- Subscribe to Message
- Mute Message
- Subscribe to RSS Feed
- Permalink
- Report Inappropriate Content
@Rob_Jordan, the basic difference between pie chart and timechart is that while pie chart has two series result and title, timechart already has an additional field _time besides result and title. Which implies when you split Timechart for Trellis (one split is _time), you can either use result or title but not both.
You can change the Trellis Split By option as title or result
    <option name="trellis.enabled">1</option>
    <option name="trellis.scales.shared">0</option>
    <option name="trellis.size">small</option>
    <option name="trellis.splitBy">title</option>
| makeresults | eval message= "Happy Splunking!!!"
- Mark as New
- Bookmark Message
- Subscribe to Message
- Mute Message
- Subscribe to RSS Feed
- Permalink
- Report Inappropriate Content
Right, so when I use trellis with a timechart, I essentially lose my split-by clause that's that's normally available to use for coloring my timechart. I'm just thinking that it was a missed opportunity for the initial trellis release and will hopefully be in the next version.
- Mark as New
- Bookmark Message
- Subscribe to Message
- Mute Message
- Subscribe to RSS Feed
- Permalink
- Report Inappropriate Content
Sure who would not love that :). But I feel it would be complete change from Trellis based on x and y series to x, y and z series.
I was able to split by either title or result but obviously not both because there is already a depiction of _time. I am not sure whether you were able to do the same or not.
| makeresults | eval message= "Happy Splunking!!!"
- Mark as New
- Bookmark Message
- Subscribe to Message
- Mute Message
- Subscribe to RSS Feed
- Permalink
- Report Inappropriate Content
I get that it doesn't do that today, hence my title of FEATURE REQUEST, however, I feel you should be able to do this even if it's with the chart or stats lead-in commands instead of a timechart command. I also feel it closely aligns with the Trellis use case to save both time and search resources on dashboard creation.


