Turn on suggestions
Auto-suggest helps you quickly narrow down your search results by suggesting possible matches as you type.
Showing results for
Splunk Search
Turn on suggestions
Auto-suggest helps you quickly narrow down your search results by suggesting possible matches as you type.
Showing results for
- Splunk Answers
- :
- Using Splunk
- :
- Splunk Search
- :
- Dots/gaps in timechart when using sum(packets) by ...
Options
- Subscribe to RSS Feed
- Mark Topic as New
- Mark Topic as Read
- Float this Topic for Current User
- Bookmark Topic
- Subscribe to Topic
- Mute Topic
- Printer Friendly Page
- Mark as New
- Bookmark Message
- Subscribe to Message
- Mute Message
- Subscribe to RSS Feed
- Permalink
- Report Inappropriate Content
splunklearner12
Path Finder
06-26-2019
08:10 AM
When I use "(base search) | timechart sum(packets) by destination useother=f usenull=f", I get gaps in my timechart:
When I use a longer time frame of 1 day, I also get gaps:
In another timechart, I have the exact same base search and just "| timechart sum(packets)", and it has no gaps. I found that when I add "by destination" to this one, it also gets the gaps/dots.
As far as I can see on https://docs.splunk.com/Documentation/Splunk/7.3.0/SearchReference/Timechart timechart should convert null values to 0 by default...
Any ideas?
1 Solution
- Mark as New
- Bookmark Message
- Subscribe to Message
- Mute Message
- Subscribe to RSS Feed
- Permalink
- Report Inappropriate Content
adonio
Ultra Champion
06-26-2019
12:54 PM
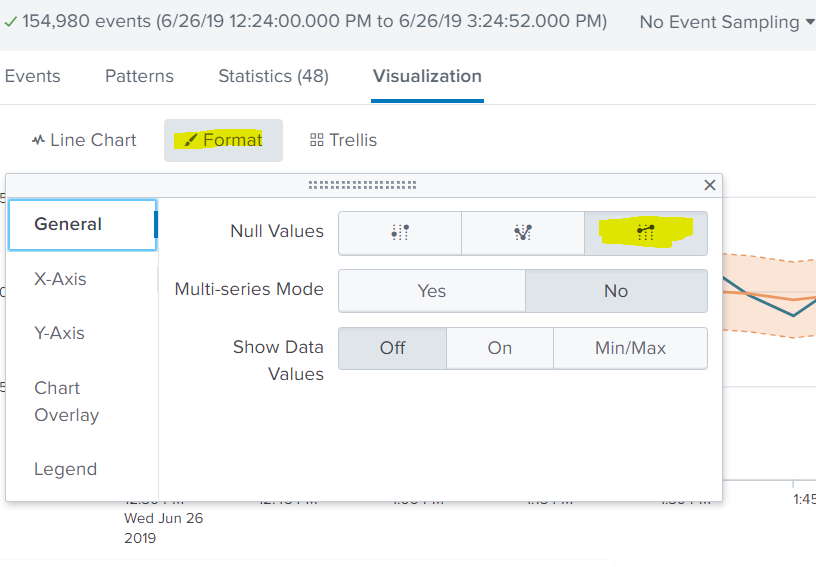
under visualization -> click format -> general tab -> click on connect in "Null Value" line
see attached screenshot
- Mark as New
- Bookmark Message
- Subscribe to Message
- Mute Message
- Subscribe to RSS Feed
- Permalink
- Report Inappropriate Content
adonio
Ultra Champion
06-26-2019
12:54 PM
- Mark as New
- Bookmark Message
- Subscribe to Message
- Mute Message
- Subscribe to RSS Feed
- Permalink
- Report Inappropriate Content
splunklearner12
Path Finder
06-27-2019
01:04 AM
Thank you for that simple solution. I found the second option called "Zero" looked nicer though!
Get Updates on the Splunk Community!
Extending Observability Content to Splunk Cloud
Watch Now!
In this Extending Observability Content to Splunk Cloud Tech Talk, you'll see how to leverage ...
More Control Over Your Monitoring Costs with Archived Metrics!
What if there was a way you could keep all the metrics data you need while saving on storage costs?This is now ...
New in Observability Cloud - Explicit Bucket Histograms
Splunk introduces native support for histograms as a metric data type within Observability Cloud with Explicit ...


