Join the Conversation
- Find Answers
- :
- Using Splunk
- :
- Splunk Search
- :
- Chart logon session duration:hour of day as x axis...
- Subscribe to RSS Feed
- Mark Topic as New
- Mark Topic as Read
- Float this Topic for Current User
- Bookmark Topic
- Subscribe to Topic
- Mute Topic
- Printer Friendly Page
- Mark as New
- Bookmark Message
- Subscribe to Message
- Mute Message
- Subscribe to RSS Feed
- Permalink
- Report Inappropriate Content
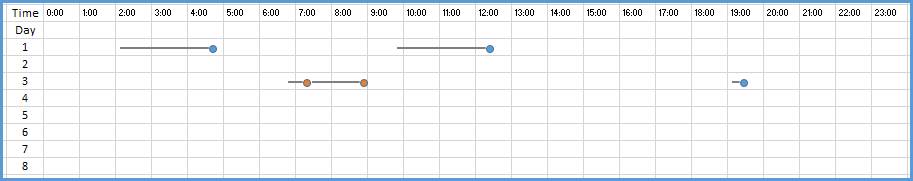
Chart logon session duration:hour of day as x axis and day of the month as y axis, duration of session as a line segment
Hi,
I have a couple of logs showing user login and logout sessions. I'm trying to display each session of a specific user as in the picture shown below:

The X-axis represents the hour of the day, and the Y-axis represents the day on the month. Each line segment should represent an individual session and the duration should correspond to it's length. Each segment should also be color coded according to the reason for the logout, be it idle timeout for user requested logout.
I have already calculated the following fields:
- Login Time
- Logout Time
- Logout Reason
- Session Duration
I managed to get a scatter plot working with the following segment of code:
  index=** source=** sourcetype=** User=**
    | eval endhour=( (date_hour*3600)+(date_minute*60)+date_second)
    | eval starthour=endhour-duration
    | eval hour=starthour.",".endhour
    | makemv delim="," hour
    | mvexpand hour
    | table reason hour date_mday
    | streamstats count
    | eval Mod= count % 2
    | eval Status= if(Mod==0,"Connected Started",reason)
    | table Status hour date_mday
    | eval hour=hour/3600
The code takes each disconnection reason, and the starting of each connection as an event, and just plots the point on the scatterplot. As shown:

However, what I ultimately want to achieve is a graph that looks like the first picture, but I've been unable to get it to do so. I've tried charting my data using xyseries and timechart but I just can't get it to work.
Help would be greatly appreciated! Thanks!
- Mark as New
- Bookmark Message
- Subscribe to Message
- Mute Message
- Subscribe to RSS Feed
- Permalink
- Report Inappropriate Content
Curious did you find a solution for this? Trying to do the same thing
- Mark as New
- Bookmark Message
- Subscribe to Message
- Mute Message
- Subscribe to RSS Feed
- Permalink
- Report Inappropriate Content
@mngeow based on the details and mock screenshot provided, you should look into following two custom visualizations:
1) Timeline Custom Visualization
2) Punchcard Custom Visualization
| makeresults | eval message= "Happy Splunking!!!"
Upcoming Webinar: Unmasking Insider Threats with Slunk Enterprise Security’s UEBA
.conf25 technical session recap of Observability for Gen AI: Monitoring LLM ...
A Season of Skills: New Splunk Courses to Light Up Your Learning Journey
