- Splunk Answers
- :
- Using Splunk
- :
- Splunk Search
- :
- Re: Average of current time window over last week
- Subscribe to RSS Feed
- Mark Topic as New
- Mark Topic as Read
- Float this Topic for Current User
- Bookmark Topic
- Subscribe to Topic
- Mute Topic
- Printer Friendly Page
- Mark as New
- Bookmark Message
- Subscribe to Message
- Mute Message
- Subscribe to RSS Feed
- Permalink
- Report Inappropriate Content
Average of current time window over last week?
Still working on this. I want to create a single pane dashboard panel with trend indicator.
This value is going to display:
The current count of events over the last 3 hours and the trendline will display the deviation from the average count over the same 3 hour timespan over the last week.
- Mark as New
- Bookmark Message
- Subscribe to Message
- Mute Message
- Subscribe to RSS Feed
- Permalink
- Report Inappropriate Content
Lets say the average over that same time window over the last week is 150, it should show 100 in the panel with a down arrow of 40%
- Mark as New
- Bookmark Message
- Subscribe to Message
- Mute Message
- Subscribe to RSS Feed
- Permalink
- Report Inappropriate Content
If I am running a search at 6pm, I want to snap to the 3, 4, and 5 pm window (so we arent getting partial counts within the hour 6). Lets say that count is 100. Now I want to compare that 100 to the average of the same time window over the last 7 days
- Mark as New
- Bookmark Message
- Subscribe to Message
- Mute Message
- Subscribe to RSS Feed
- Permalink
- Report Inappropriate Content
Got it - I don't believe you can get the comparison between two fields, so what you will need to do is calculate the counts, calculate the average and then make the count contain the average for the previous week.
This run anywhere example - if you can see the _audit index.
Set the time picker to be earliest as -3h@h and latest=@h
It will search for the last 3 hours and then also the same period for 7 days prior.
It then timecharts the counts (note span=24h, not 1d, so that it will work when time range is after 10pm)
then it calculates average and removes all but the latest 2 rows
Finally it replaces count with the average for the week.
Then in the single panel, you can display a percentage vs last 24h.
index=_audit [
  | makeresults
  | fields - _time
  | addinfo
  | fields info_min_time info_max_time
  | rename info_min_time as earliest info_max_time as latest
  | eval n=mvrange(0,8,1)
  | mvexpand n
  | eval earliest = earliest - (n * 86400), latest = latest - (n * 86400)
  | fields - n
  | format ]
| timechart span=24h count
| streamstats c
| eventstats avg(eval(if(c>1, count, null()))) as avg
| where c<=2
| eval count=if(c=2, avg, count)
| fields - c
- Mark as New
- Bookmark Message
- Subscribe to Message
- Mute Message
- Subscribe to RSS Feed
- Permalink
- Report Inappropriate Content
Not sure I get what you're trying to show, let's say you have 1 event per minute over 3 hours, so the current count over the last 3 hours shows 180
If last week in the same 3 hour period, you got 1.5 events per minute over 3 hours, your total is 270 events.
What do you mean by 'average' count over last week's 3 hours timespan? How many data points do you want that trendline to show?
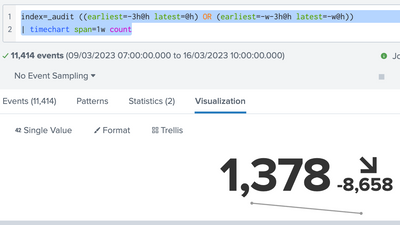
This shows a trendline for the count of last week vs the count of now, but not sure how you want the average to work

