- Splunk Answers
- :
- Using Splunk
- :
- Splunk Search
- :
- Append causing dashboard panels to use colours for...
- Subscribe to RSS Feed
- Mark Topic as New
- Mark Topic as Read
- Float this Topic for Current User
- Bookmark Topic
- Subscribe to Topic
- Mute Topic
- Printer Friendly Page
- Mark as New
- Bookmark Message
- Subscribe to Message
- Mute Message
- Subscribe to RSS Feed
- Permalink
- Report Inappropriate Content
In my dashboard, I have "Alerts Open" timechart single value panels with colour ranges that are using the following searches:
index="<client>" case_id | dedup 1 case_id sortby -_time | search (status=new OR status=under_investigation) | timechart sum(alert_count) as alert_count_total | addcoltotals
This works fine in all aspects when there are actually alerts open.
However, I found that when no alerts are open then it simply displays "No results found" but I wanted it to stay on 0. I tried using "if(isnull" and "fillnull" neither of which worked but I found that using the following search resolves this:
index="<client>" case_id | dedup 1 case_id sortby -_time | search (status=new OR status=under_investigation) | timechart sum(alert_count) as alert_count_total | append [| stats count as alert_count] | addcoltotals
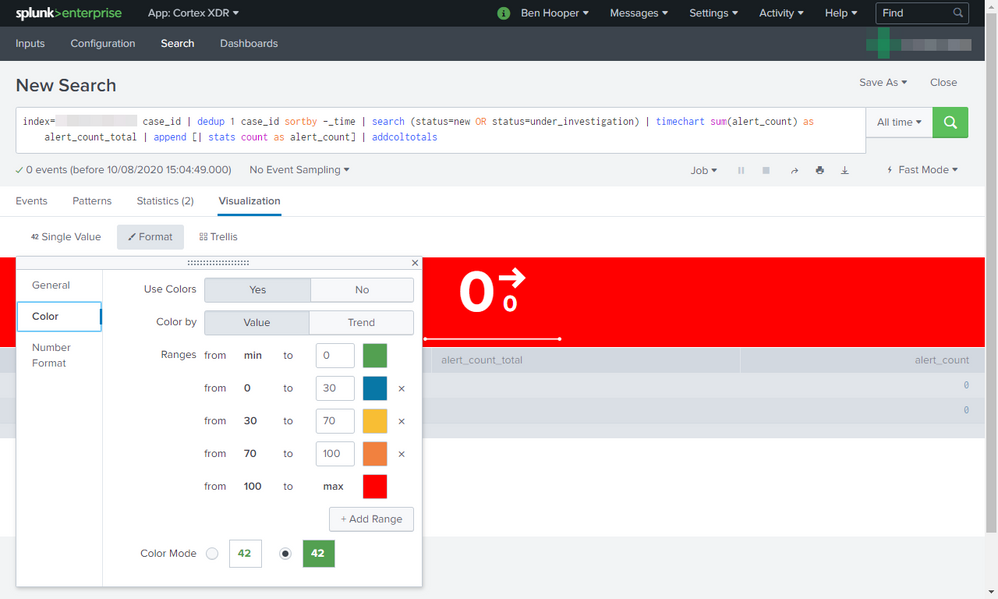
However, a side of that is that the panels are now using the colours for the max ranges, even though the value is 0 and the max ranges are, for example, "from 100 to max". This can be seen below.
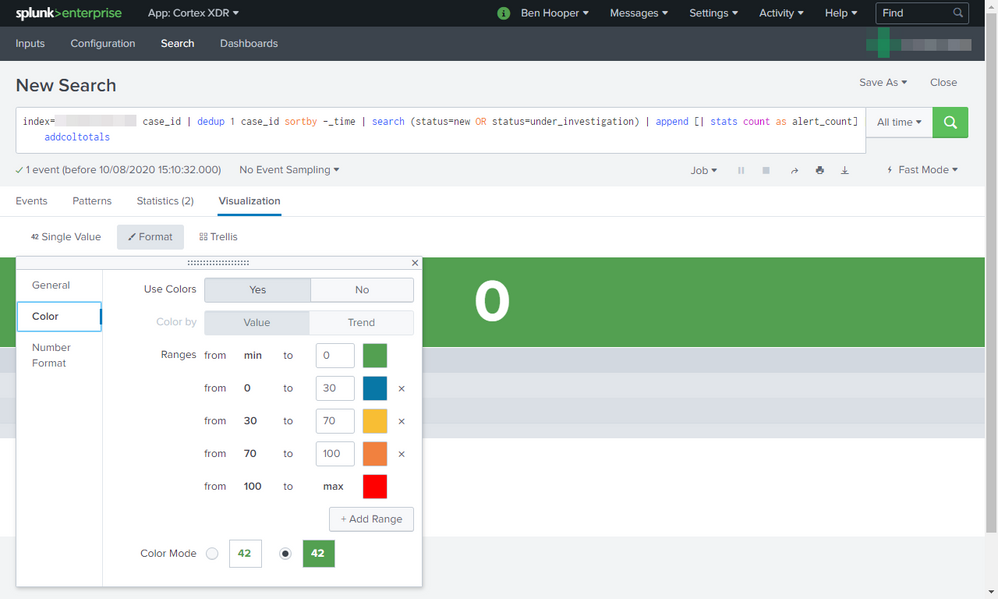
For some reason, it seems that it's the timechart that's causing this because removing it uses the correct colours. This can be seen below.
- Mark as New
- Bookmark Message
- Subscribe to Message
- Mute Message
- Subscribe to RSS Feed
- Permalink
- Report Inappropriate Content
I found:
- That it was actually the lack of events that was causing this.
- https://community.splunk.com/t5/Archive/Evaluate-if-there-are-no-search-results-or-events-for-a-fiel... which recommended using makeresults so I replaced "append [| stats count as alert_count]" with "append [| makeresults | eval alert_count_total = 0]" which resolved the problem.


