- Splunk Answers
- :
- Splunk Premium Solutions
- :
- Security Premium Solutions
- :
- Splunk SOAR (f.k.a. Phantom)
- :
- How to customize the Phantom dashboard time filter...
- Subscribe to RSS Feed
- Mark Topic as New
- Mark Topic as Read
- Float this Topic for Current User
- Bookmark Topic
- Subscribe to Topic
- Mute Topic
- Printer Friendly Page
- Mark as New
- Bookmark Message
- Subscribe to Message
- Mute Message
- Subscribe to RSS Feed
- Permalink
- Report Inappropriate Content
How to customize the Phantom dashboard time filters dropdown box?
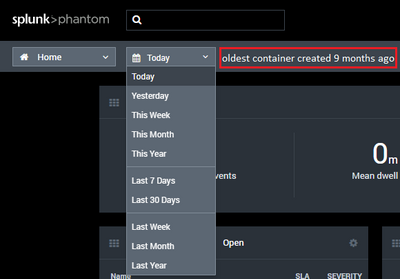
How to customize the Phantom dashboard time filters dropdown box (see screenshot below)?
For a Phantom instance, we have started exploring using the data retention features of Splunk Phantom keeping less than 1 year of Phantom data. It is desired to have a maximum filter equal to the current number of days for data retention. Otherwise, users are misled by time filters that are more than current number of days for data retention. A feature that might nice to have is a way to tie the Phantom dashboard time filters dropdown box to the days of data retention.
- Mark as New
- Bookmark Message
- Subscribe to Message
- Mute Message
- Subscribe to RSS Feed
- Permalink
- Report Inappropriate Content
@jeffrey_berry I think I am struggling because although I think it adds great context in a SIEM where you are looking for time-based information, Splunk SOAR is a Security Automation Platform & I am failing to see the value add for automating security response.
Now I am not a daily administrator of the platform so appreciate your experience is completely different to mine!
If you are externalising your SOAR platform's data to an Externally Managed Splunk Enterprise instance then that is the best practise and best place to create the rich dashboards and that has always been my recommendation over the years. I am also only one person so don't let me stop you raising an idea! If you think it's valid then someone else might and you can always try to get some support from the community!
Happy Phantoming SOARing
- Mark as New
- Bookmark Message
- Subscribe to Message
- Mute Message
- Subscribe to RSS Feed
- Permalink
- Report Inappropriate Content
@phanTom In a large organization as you may know, the focus and expectations of users can be vary widely. It sounds like your energy may be low for a feature request to allow customization of the Phantom dashboard time filters. With one of my many roles being a Phantom admin, I do not desire to understand and maintain an additional setting that someone suggests is value added to Phantom unless several folks agree with it. What are your thoughts on a feature request for text next to the time filter dropdown that communicates the create time of the oldest container record or something similar to give the user more info about the data in the Phantom dashboard (see1st screenshot below)? Do you think that the Phantom community would be more supportive of it? As a comparison, the Splunk Enterprise search dashboard has a graph to indicate that amount of data available (see second screenshot below). Custom Splunk Enterprise dashboards much more capabilities to fulfill user requests like this one than the Phantom product. For a more direct comparison, a Splunk Enterprise user can select their own home dashboard (custom or not) in the Search app (see third screenshot below).
- Mark as New
- Bookmark Message
- Subscribe to Message
- Mute Message
- Subscribe to RSS Feed
- Permalink
- Report Inappropriate Content
@jeffrey_berry I understand the ask but Splunk doesn't do this so not sure the benefit. Surely if you put 1y and only have 9months of data it will only show 9months and I wouldn't call that misleading as such?
However if you feel it worthy please add an idea to https://ideas.splunk.com/ and get people to up-vote it. This has been very successful in getting some great features into the platform! E.G. I asked for the scope toggle on action blocks and it only took a few months to make it to the platform!


