- Splunk Answers
- :
- Splunk Platform Products
- :
- Splunk Enterprise
- :
- Re: forward data shaped on 150mbps and event loses
- Subscribe to RSS Feed
- Mark Topic as New
- Mark Topic as Read
- Float this Topic for Current User
- Bookmark Topic
- Subscribe to Topic
- Mute Topic
- Printer Friendly Page
- Mark as New
- Bookmark Message
- Subscribe to Message
- Mute Message
- Subscribe to RSS Feed
- Permalink
- Report Inappropriate Content
Hi
i have a firewall that send syslog data to my splunk HF
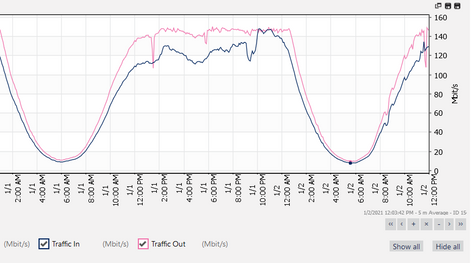
my problem is that when syslog stream data go high (over than 130mbps) , HF forward data at maximum 150mbps (shaped on network graph) and events loses
there is no error or log that show what happen to my data or events on HF,UF,Indexers(no queue,bufer or connection error ,no splunkd.log error or warning)
there is much Hardware Resource on all Splunk Cluster VMs: 12Core CPU(2.4Ghz) 20GB of Ram and SSD in all splunk VMs
note (i dont use any event filtering or special process on data in HF in yet , just data get in and forward)
is there any limit ? if yes what can i do with this scenario ?
- Mark as New
- Bookmark Message
- Subscribe to Message
- Mute Message
- Subscribe to RSS Feed
- Permalink
- Report Inappropriate Content
Hi,
first thing is that it is not a best pratice to collect syslog with Splunk HF, see Syslog topic in splunk-validated-architectures.pdf
if you want to keep with that setup, you can try to increase pipelines (see https://docs.splunk.com/Documentation/Splunk/latest/Indexer/Pipelinesets ) (this will only do something if your syslog data can be seen as multiple inputs, if you have only one source, look at alternatives such as SC4S)
you should probably also look at :
- os kernel (tcp/ip) buffers for syslog
- increase queue size at splunk level (inputs and outputs at least on the forwarder but also queues on indexers)
- make sure data is load balanced correctly
- Mark as New
- Bookmark Message
- Subscribe to Message
- Mute Message
- Subscribe to RSS Feed
- Permalink
- Report Inappropriate Content
Hai
saya memiliki firewall yang mengirim data syslog ke HF splunk saya
masalah saya adalah ketika data aliran syslog menjadi tinggi (lebih dari 130mbps), data. HF pada maksimum 150mbps (berbentuk grafik jaringan) dan peristiwa hilang
tidak ada kesalahan atau log yang menunjukkan apa yang terjadi pada data atau peristiwa saya di HF, UF, Pengindeks (tidak ada antrian, bufer atau kesalahan koneksi, tidak ada kesalahan atau kesalahan peringatan splunkd.log)
ada banyak Sumber Daya Hardware pada semua S p lunk Clu s ter VM: 12Core CPU (2.4Ghz) 20GB Ram dan SSD di semua splunk VMS
catatan (id o nt menggunakan acara penyaringan atau proses khusus pada data di HF dalam belum, hanya data yang masuk dan ke depan)
- Mark as New
- Bookmark Message
- Subscribe to Message
- Mute Message
- Subscribe to RSS Feed
- Permalink
- Report Inappropriate Content
Hi,
first thing is that it is not a best pratice to collect syslog with Splunk HF, see Syslog topic in splunk-validated-architectures.pdf
if you want to keep with that setup, you can try to increase pipelines (see https://docs.splunk.com/Documentation/Splunk/latest/Indexer/Pipelinesets ) (this will only do something if your syslog data can be seen as multiple inputs, if you have only one source, look at alternatives such as SC4S)
you should probably also look at :
- os kernel (tcp/ip) buffers for syslog
- increase queue size at splunk level (inputs and outputs at least on the forwarder but also queues on indexers)
- make sure data is load balanced correctly
- Mark as New
- Bookmark Message
- Subscribe to Message
- Mute Message
- Subscribe to RSS Feed
- Permalink
- Report Inappropriate Content
was great help, thank you!
but in end, i did somthing else , i use NginX UDP Loadbalancer and 2xUF (with optimized configuration and OS improvment )
why UDP LB ? because use syslog-ng make my Storage busy Twice(write in syslog-ng + indexers) but we need to keep the storage(SAN) in low disk I/O and in other hand, i need events be on splunk soon as soon, so i send direct syslog stream to UFs
and now i have 4,000,000,000 event on last 3days without event lost

