- Splunk Answers
- :
- Splunk Platform Products
- :
- Splunk Enterprise
- :
- Why are events breaking using props conf?
- Subscribe to RSS Feed
- Mark Topic as New
- Mark Topic as Read
- Float this Topic for Current User
- Bookmark Topic
- Subscribe to Topic
- Mute Topic
- Printer Friendly Page
- Mark as New
- Bookmark Message
- Subscribe to Message
- Mute Message
- Subscribe to RSS Feed
- Permalink
- Report Inappropriate Content
Why are events breaking using props conf?

- Mark as New
- Bookmark Message
- Subscribe to Message
- Mute Message
- Subscribe to RSS Feed
- Permalink
- Report Inappropriate Content
Try this config and then restart the Splunk instance.
- Mark as New
- Bookmark Message
- Subscribe to Message
- Mute Message
- Subscribe to RSS Feed
- Permalink
- Report Inappropriate Content
It looks like the LINE_BREAKER setting needs to be adjusted. The current setting has Splunk looking for the string "confluent_kafka_" followed by a space, but that does not match what is in the event. Additionally, the first capture group, which is always discarded by Splunk, appears to contain important information.
Try LINE_BREAKER = ()confluent_kafka_server_request_bytes\{
If this reply helps you, Karma would be appreciated.
- Mark as New
- Bookmark Message
- Subscribe to Message
- Mute Message
- Subscribe to RSS Feed
- Permalink
- Report Inappropriate Content
tried this but its not working.
- Mark as New
- Bookmark Message
- Subscribe to Message
- Mute Message
- Subscribe to RSS Feed
- Permalink
- Report Inappropriate Content
"its not working" isn't helpful.
Did you restart the indexer(s)? Are you looking at data that was onboarded after the change (and restart)? Existing data won't change.
Can you share raw data (before Splunk touches it)?
If this reply helps you, Karma would be appreciated.
- Mark as New
- Bookmark Message
- Subscribe to Message
- Mute Message
- Subscribe to RSS Feed
- Permalink
- Report Inappropriate Content
yes I restarted it.
below is the RAW data how its getting caputured. Below is a single event, but we need to split or break every line as a indivisual events .
-----------------------------------------------------------------------------------------------------------------------------------
# HELP confluent_kafka_server_request_bytes The delta count of total request bytes from the specified request types sent over the network. Each sample is the number of bytes sent since the previous data point. The count is sampled every 60 seconds.
# TYPE confluent_kafka_server_request_bytes gauge
confluent_kafka_server_request_bytes{kafka_id="trtrtrt",principal_id="4343fgfg",type="ApiVersions",} 0.0 1684127220000
confluent_kafka_server_request_bytes{kafka_id="trtrtrt",principal_id="5656ghgh",type="ApiVersions",} 0.0 1684127220000
confluent_kafka_server_request_bytes{kafka_id="trtrtrt",principal_id="5656ghgh",type="Fetch",} 18000.0 1684127220000
confluent_kafka_server_request_bytes{kafka_id="trtrtrt",principal_id="4343fgfg",type="Metadata",} 0.0 1684127220000
confluent_kafka_server_request_bytes{kafka_id="trtrtrt",principal_id="5656ghgh",type="Metadata",} 0.0 1684127220000
# HELP confluent_kafka_server_response_bytes The delta count of total response bytes from the specified response types sent over the network. Each sample is the number of bytes sent since the previous data point. The count is sampled every 60 seconds.
# TYPE confluent_kafka_server_response_bytes gauge
confluent_kafka_server_response_bytes{kafka_id="trtrtrt",principal_id="4343fgfg",type="ApiVersions",} 0.0 1684127220000
confluent_kafka_server_response_bytes{kafka_id="trtrtrt",principal_id="5656ghgh",type="ApiVersions",} 0.0 1684127220000
confluent_kafka_server_response_bytes{kafka_id="trtrtrt",principal_id="5656ghgh",type="Fetch",} 5040.0 1684127220000
confluent_kafka_server_response_bytes{kafka_id="trtrtrt",principal_id="4343fgfg",type="Metadata",} 0.0 1684127220000
confluent_kafka_server_response_bytes{kafka_id="trtrtrt",principal_id="5656ghgh",type="Metadata",} 0.0 1684127220000
confluent_kafka_server_response_bytes{kafka_id="yuuyu",principal_id="hyyu44",type="ApiVersions",} 0.0 1684127220000
confluent_kafka_server_response_bytes{kafka_id="yuuyu",principal_id="hyyu44",type="Metadata",} 0.0 1684127220000
# HELP confluent_kafka_server_received_bytes The delta count of bytes of the customer's data received from the network. Each sample is the number of bytes received since the previous data sample. The count is sampled every 60 seconds.
# TYPE confluent_kafka_server_received_bytes gauge
confluent_kafka_server_received_bytes{kafka_id="yuyuyu",topic="tytytytuyu-processing-log",} 0.0 1684127220000
confluent_kafka_server_received_bytes{kafka_id="yuyuyu",topic="hhhh.kk.json.cs.order.fulfilment.auto.pricing.retry",} 553822.0 1684127220000
confluent_kafka_server_received_bytes{kafka_id="yuyuyu",topic="hhhh.kk.json.cs.order.yy",} 0.0 1684127220000
confluent_kafka_server_received_bytes{kafka_id="uiuiui",topic="topic_0",} 35385.0 1684127220000
# HELP confluent_kafka_server_sent_bytes The delta count of bytes of the customer's data sent over the network. Each sample is the number of bytes sent since the previous data point. The count is sampled every 60 seconds.
# TYPE confluent_kafka_server_sent_bytes gauge
confluent_kafka_server_sent_bytes{kafka_id="uiuiuiu",topic="_confluent-controlcenter-7-3-0-0-MonitoringMessageAggregatorWindows-THREE_HOURS-changelog",} 0.0 1684127220000
confluent_kafka_server_sent_bytes{kafka_id="yuyuyuy",topic="kafka-connector.connect-configs",} 0.0 1684127220000
confluent_kafka_server_sent_bytes{kafka_id="yuyuyuy",topic="kafka.replicator-configs",} 0.0 1684127220000
confluent_kafka_server_sent_bytes{kafka_id="yuyuyuy",topic="tytyty-log",} 0.0 1684127220000
confluent_kafka_server_sent_bytes{kafka_id="yuyuyuy",topic="success-lcc-trttytyty",} 0.0 1684127220000
# HELP confluent_kafka_server_received_records The delta count of records received. Each sample is the number of records received since the previous data sample. The count is sampled every 60 seconds.
# TYPE confluent_kafka_server_received_records gauge
confluent_kafka_server_received_records{kafka_id="yuyuyu",topic="tytytytuyu-processing-log",} 0.0 1684127220000
confluent_kafka_server_received_records{kafka_id="yuyuyu",topic="hhhh.kk.json.cs.order.fulfilment.auto.pricing.retry",} 24.0 1684127220000
confluent_kafka_server_received_records{kafka_id="yuyuyu",topic="hhhh.kk.json.cs.order.yy",} 0.0 1684127220000
confluent_kafka_server_received_records{kafka_id="uiuiui",topic="topic_0",} 126.0 1684127220000
# HELP confluent_kafka_server_sent_records The delta count of records sent. Each sample is the number of records sent since the previous data point. The count is sampled every 60 seconds.
# TYPE confluent_kafka_server_sent_records gauge
confluent_kafka_server_sent_records{kafka_id="yuyuyu",topic="tytytytuyu-processing-log",} 0.0 1684127220000
confluent_kafka_server_sent_records{kafka_id="yuyuyu",topic="hhhh.kk.json.cs.order.fulfilment.auto.pricing.retry",} 24.0 1684127220000
confluent_kafka_server_sent_records{kafka_id="yuyuyu",topic="hhhh.kk.json.cs.order.yy",} 0.0 1684127220000
confluent_kafka_server_sent_records{kafka_id="uiuiuiu",topic="_confluent-command",} 0.0 1684127220000
confluent_kafka_server_sent_records{kafka_id="uiuiuiu",topic="_confluent-controlcenter-7-3-0-0-AlertHistoryStore-changelog",} 0.0 1684127220000
confluent_kafka_server_sent_records{kafka_id="yuyuyuy",topic="kafka-connector.connect-configs",} 0.0 1684127220000
confluent_kafka_server_sent_records{kafka_id="yuyuyuy",topic="kafka.replicator-configs",} 0.0 1684127220000
confluent_kafka_server_retained_bytes{kafka_id="uiuiuiu",topic="_confluent-controlcenter-7-3-0-0-monitoring-aggregate-rekey-store-repartition",} 0.0 1684127220000
confluent_kafka_server_retained_bytes{kafka_id="uiuiuiu",topic="_confluent-controlcenter-7-3-0-0-monitoring-message-rekey-store",} 7.148088E7 1684127220000
confluent_kafka_server_retained_bytes{kafka_id="uiuiuiu",topic="_confluent-controlcenter-7-3-0-0-monitoring-trigger-event-rekey",} 5.0344769E7 1684127220000
- Mark as New
- Bookmark Message
- Subscribe to Message
- Mute Message
- Subscribe to RSS Feed
- Permalink
- Report Inappropriate Content
This works in my sandbox with the provided sample data.
LINE_BREAKER = ([\r\n]+)confluent_kafka_server_(request|response|received|sent|retained)_(bytes|records)If this reply helps you, Karma would be appreciated.
- Mark as New
- Bookmark Message
- Subscribe to Message
- Mute Message
- Subscribe to RSS Feed
- Permalink
- Report Inappropriate Content
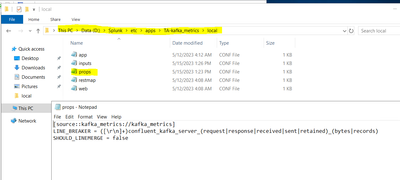
Hmm, not sure whats wrong with my setup, I have modified the props.conf as below and restarted the splunk service. Still its coming as a single event.
- Mark as New
- Bookmark Message
- Subscribe to Message
- Mute Message
- Subscribe to RSS Feed
- Permalink
- Report Inappropriate Content
I wonder if the problem lies with the stanza name rather than the LINE_BREAKER setting. If the name in a source::// stanza doesn't match the name of the data source then the settings will not be applied.
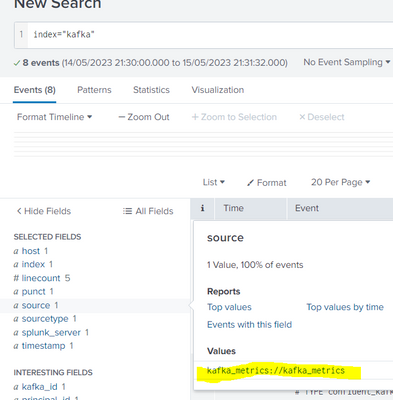
A source named "kafka_metrics://kafka_metrics" seems like a rather odd file name. Are you sure that's the correct source name? How are you obtaining the name?
If this reply helps you, Karma would be appreciated.
- Mark as New
- Bookmark Message
- Subscribe to Message
- Mute Message
- Subscribe to RSS Feed
- Permalink
- Report Inappropriate Content
yes, source="kafka_metrics://kafka_metrics" as you can see here below;
- Mark as New
- Bookmark Message
- Subscribe to Message
- Mute Message
- Subscribe to RSS Feed
- Permalink
- Report Inappropriate Content
Is that the *raw* source name, before any Splunk transforms?
Can you change the stanza to a sourcetype one, at least to confirm the regex is correct?
If this reply helps you, Karma would be appreciated.
- Mark as New
- Bookmark Message
- Subscribe to Message
- Mute Message
- Subscribe to RSS Feed
- Permalink
- Report Inappropriate Content
our sourcetype=kafka_metrics, now i have modified the props.conf as below, but still the same issue. Do i need to change anything in transforms.conf as well?
- Mark as New
- Bookmark Message
- Subscribe to Message
- Mute Message
- Subscribe to RSS Feed
- Permalink
- Report Inappropriate Content
Any news ?
How did you solve that issue, if ever ?
- Mark as New
- Bookmark Message
- Subscribe to Message
- Mute Message
- Subscribe to RSS Feed
- Permalink
- Report Inappropriate Content
The screenshot says "props". Is that the actual file name? It should be props.conf.
It's difficult to determine if changes need to be made to transforms.conf without seeing the file, but since props.conf does not reference any transforms I'd say "no".
I'm still waiting for an answer to this earlier question: Are you looking at data that was onboarded after the change (and restart)?
How is the script(?) that is making the API calls tagging the data as sourcetype=kafka_metrics? How is the data being sent to Splunk?
If this reply helps you, Karma would be appreciated.


