- Splunk Answers
- :
- Splunk Platform Products
- :
- Splunk Enterprise
- :
- Re: Splunk panel taking 20 seconds to load, but th...
- Subscribe to RSS Feed
- Mark Topic as New
- Mark Topic as Read
- Float this Topic for Current User
- Bookmark Topic
- Subscribe to Topic
- Mute Topic
- Printer Friendly Page
- Mark as New
- Bookmark Message
- Subscribe to Message
- Mute Message
- Subscribe to RSS Feed
- Permalink
- Report Inappropriate Content
Splunk panel taking 20 seconds to load, but the inspect says ".7 seconds"?
Hi
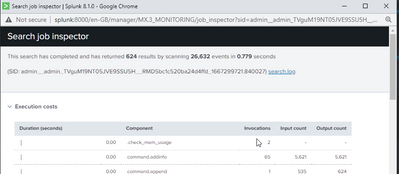
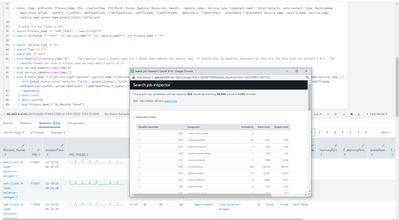
I have a Splunk panel that takes ~20 seconds to load, but when I click on the inspect it tells me it took .7 seconds to load.
When I pull it out to just SPL it does run fast, it is just the final visualization that seems to take extra time in the Splunk pannel. Is there anything I can do here or a way to monitor this? OR how do I fix the lag?
For information, I am running Splunk 8.1 on one SH with 3 Indexers.
To add once it is loaded it works fine - its just the initial load that is very slow
- Mark as New
- Bookmark Message
- Subscribe to Message
- Mute Message
- Subscribe to RSS Feed
- Permalink
- Report Inappropriate Content
How are you generating the multivalued filters for services_type and type? Are you using base searches in the dashboard?
- Mark as New
- Bookmark Message
- Subscribe to Message
- Mute Message
- Subscribe to RSS Feed
- Permalink
- Report Inappropriate Content
Hi
Yes, I use 2 base search .
One base search for the initial data pull.
Then a second base search to refine the data filters etc.. so we don't have to keep re-running the initial data pull if something is changed. I have used this before on many dashboards, but this is the first where is it so slow to load.
However, to test this out - I removed all the base searches and put the code directly into the panel and it now works super quickly... This is a bit disappointing as I thought using base search in this structured way was a good way to reduce code replication, but in the end, if I have to put the code into all the panels if I want fast pannels it can become difficult to update a dashboard easily.
Is there any way to get around this?
- Mark as New
- Bookmark Message
- Subscribe to Message
- Mute Message
- Subscribe to RSS Feed
- Permalink
- Report Inappropriate Content
If you're willing to provide the query of the base searches, i'll be happy to help optimize it.
- Mark as New
- Bookmark Message
- Subscribe to Message
- Mute Message
- Subscribe to RSS Feed
- Permalink
- Report Inappropriate Content
Hi
Please note this is very long and complex. So if you don't have a suggestion, don't worry.
We are using metric data.
Below is the 2 base search, then in each pannel I call base search 2 and filter or display what is needed.
The initial saved search is this, this is inside the first basesearch. But it all runs in .7 seconds, it's not the search that is slow. It is when I am trying to display it.
| savedsearch Process_Data_Pull_v12_Report mx_env="dell730srv.fr.murex.com:15022" BPC_VALUE_TOKEN="*"
| mstats prestats=t latest("mx.process.errors.status") latest("mx.replica.status") latest("mx.process.resources.status") WHERE "index"="murex_metrics" AND mx.env=dell730srv.fr.murex.com:15022 BY service.name replica.name service.type parent.name
| eval threshold="", pid="", cmd="", "host"="", "component.name"=""
| mstats append=t prestats=t latest("mx.process.memory.usage") latest("mx.process.up.time") latest("mx.process.creation.time") WHERE "index"="murex_metrics" AND mx.env=dell730srv.fr.murex.com:15022 BY pid cmd service.type host service.name replica.name component.name threshold parent.name
| rename "service.name" as service_name
| rename "replica.name" as replica_name
| rename "service.type" as service_type
| stats latest("mx.process.errors.status") as Health latest("mx.process.resources.status") as Resources latest("mx.process.up.time") as upTime latest("mx.process.creation.time") as creationTime latest("mx.replica.status") as Replica latest("mx.process.memory.usage") as memoryCons by pid cmd service_type host service_name replica_name component.name threshold parent.name
| eval T_MemoryCons=if(isnull(memoryCons),"",threshold), Process_Name=((service_name . " # ") . replica_name)
| sort 0 Process_Name
| streamstats first(Replica) as Replica first(Resources) as Resources first(Health) as Health by Process_Name
| stats values(Health) as Health values(Resources) as Resources values(Replica) as Replica values(memoryCons) as memoryCons values(upTime) as upTime values(creationTime) as creationTime by pid cmd Process_Name service_type host service_name replica_name component.name parent.name
| eval Replica=case((Process_Name == "xmlserver # xmlserver"),"2",(Process_Name == "zookeeper # zookeeper"),"2",(Process_Name == "fileserver # fileserver"),"2",true(),Replica)
| where (cmd != "")
| dedup pid
| sort 0 - pid
| eval Resources=if(match(Resources,"^[\\d\\.]*$"),floor(Resources),Resources)
| eval Replica=if(match(Replica,"^[\\d\\.]*$"),floor(Replica),Replica)
| dedup pid
| join type=left pid
    [| mstats latest("mx.process.cpu.utilization") as cpuPerc WHERE "index"="murex_metrics" AND mx.env=dell730srv.fr.murex.com:15022 span=10s GroupBY pid
    | table _time pid
    | chart sparkline(count) AS "PID_PULSE" count AS Total BY pid]
| eval sparkdata=PID_PULSE
| makemv delim="," PID_PULSE
| rex field=sparkdata mode=sed "s/^ [ ^,]+,//"
| eval sparkdata=split(sparkdata,",")
| eval mvcount=mvcount(sparkdata)
| eval firstHalf=mvindex(sparkdata,0,floor((mvcount / 2)))
| eval firstHalfCountNonZero=mvcount(mvfilter((firstHalf > 0)))
| eval firstHalfCountNonZero=if(isnull(firstHalfCountNonZero),0,firstHalfCountNonZero)
| eval lastHalf=mvindex(sparkdata,ceil((mvcount / 2)),mvcount)
| eval lastHalfCountNonZero=mvcount(mvfilter((lastHalf > 0)))
| eval lastHalfCountNonZero=if(isnull(lastHalfCountNonZero),0,lastHalfCountNonZero)
| eval Pulse=case(((firstHalfCountNonZero == 0) AND (lastHalfCountNonZero > 0)),"STARTING",((firstHalfCountNonZero > 0) AND (lastHalfCountNonZero == 0)),"DEAD",((firstHalfCountNonZero > 0) AND (lastHalfCountNonZero > 0)),"ALIVE")
| sort upTime
| eval creationTime=strftime(creationTime,"%y/%m/%d %H:%M:%S")
| eval upTime=round(upTime,0)
| eval upTime=tostring(upTime,"duration")
| rename pid as PID, cmd as Type, "host" as MachineName
| fillnull Pulse value="DEAD"
| fillnull
| append
    [| mstats prestats=t latest("mx.replica.status") WHERE "index"="murex_metrics" AND mx.env=dell730srv.fr.murex.com:15022 BY service.name replica.name service.type
    | mstats append=t prestats=t latest("mx.process.cpu.utilization") WHERE "index"="murex_metrics" AND mx.env=dell730srv.fr.murex.com:15022 BY pid cmd service.type host service.name replica.name component.name threshold
    | fillnull
    | rename "service.name" as service_name
    | rename "replica.name" as replica_name
    | rename "service.type" as service_type
    | stats latest("mx.replica.status") as Replica latest("mx.process.cpu.utilization") as cpuPerc by pid cmd service_type host service_name replica_name component.name threshold
    | eval Process_Name=((service_name . " # ") . replica_name)
    | stats dc(pid) AS pid2 values(*) AS * BY Process_Name
    | where pid=0
    | rename pid as PID
    | eval Replica=substr(Replica, 1, len(Replica)-7)
    | table PID Process_Name service_name replica_name service_type Replica
    | eval PID=if(PID=0,N/A,$PID$)]
| rename service_type as Service_type
| fillnull value="N/A"
| join service_name
    [| mstats latest(mx.service.dependencies.status) as Dependencies_x WHERE "index"="murex_metrics" AND mx.env=dell730srv.fr.murex.com:15022 AND used.by="***" BY "service.name" used.by
    | dedup service.name
    | rename service.name as service_name,service.type as Service_Type]
<search id="basesearch_Process">
<!--Below base search is used for process view-->
<query>
| savedsearch Process_Data_Pull_v12_Report mx_env="$host_token$" BPC_VALUE_TOKEN="$BPC_VALUE_TOKEN$"
</query>
<earliest>-80s</earliest>
<latest>now</latest>
<sampleRatio>1</sampleRatio>
<refresh>$Refresh_Token$</refresh>
<refreshType>delay</refreshType>
</search>
<!--The main BASE SEARCH of THE VES-->
<search base="basesearch_Process" id="basesearch_Process2">
<query> | join replica_name type=left [
| mstats latest("mx.replica.restarts") as restartsNb WHERE mx.env="hp742srv.scz.murex.com:24000" AND "index"="murex_metrics" span=10s BY "replica.name" restartable host
| sort - _time
| dedup replica.name
| rename replica.name as replica_name
| sort - restartsNb
]
| fillnull restartsNb value=-1
| fillnull restartable value="N/A"
| eval allFields=" ".PID." # ".Process_Name." # ".Service_type." # ".Type." # ".MachineName." " ``` mx.replica.status by services name are all the Launcher_based services 0=Down, 1=Not Ready and 2=Ready ```
```Create a search string```
```Change the status of the xmlserver + zookeeper + fileserver to 4 = OK```
| eval Replica=case((Process_Name == "xmlserver # xmlserver"),"4",(Process_Name == "zookeeper # zookeeper"),"4",(Process_Name == "fileserver # fileserver"),"4",true(),Replica)
```Change Status 0 to 6 for the sort, so it comes out at the bottom```
| sort Pulse
| eval restarts=if(restartsNb > 0,1,4)
| eval restartsNb=round(restartsNb,0)
| eval restartsNb=if(restartsNb == -1, "N/A", restartsNb)
| rename restartsNb as total-restarts
| rename restartable as auto-restart
```Change Status 6 back to 0 this will go to NA as the sort is over for the sort, so it comes out at the bottom```
| eval global_status=min(Resources,Replica,Health,restarts)
| eval Resources=case(Resources=2,"UNKNOWN",Resources="1","KO",Resources=3,"DEGRADED",Resources="4","OK",1=1,"N/A")
| eval Replica=case(Replica=2,"UNKNOWN",Replica="1","KO",Replica=3,"DEGRADED",Replica="4","OK",1=1,"N/A")
| eval Health=case((Health == 2),"UNKNOWN",(Health == "1"),"KO",(Health == 3),"DEGRADED",(Health == "4"),"OK",true(),"N/A")
| table _time, allFields, Process_Name, PID, creationTime, PID_PULSE, Pulse, Replica, Resources, Health, replica_index, Service_type,"component.name", total-restarts, auto-restart, Type, MachineName , memoryCons upTime, cpuPerc, T_CpuPerc, nbOfOpenFiles, T_NbOfOpenFiles, nbOfThreads, T_NbOfThreads, memoryPerc, T_memoryPerc, diskIoRate T_diskIoRate service_name, replica_name, service_name, replica_name parent.name global_status config.path
```Display the Ant Tasks or NOT```
| search Process_Name != "*$TOKEN_ANT_VALUE$*" | search PID="$process_filter_token$"
| search allFields = "*$Processes_source_search_token2$*" AND service_name="$ServiceName_token_From_Service_Click$" AND replica_name="$ReplicaName_token$" AND Process_Name = "*$Launcher_name_token$"
| search Service_type IN ($servicesTypeToken$)
| search Type IN ($TypeToken$)
| where PID != "$TOKEN_REPLICAS_NO_PROCESS$"
| eval temp=split(service_name,"#") ```The launcher have a double name X # X below code removes the second copy, it should only be used for launchers as they are the ones with the pattern X # X , The launcher based can have a tripple name we only want 2 parts of it ```
| eval service_nameA=mvindex(temp,0)
| eval service_nameB=mvindex(temp,1)
| eval Process_Name = if(Service_type="launcher",service_name,if(Service_type="launcher-based",service_nameA." # ".replica_name,if(Service_type="agent-based",service_name." # ".replica_name,service_name )))
</query>
<done>
<set token="Token_0_TRAP_1">SET</set>
</done>
</search>
- Mark as New
- Bookmark Message
- Subscribe to Message
- Mute Message
- Subscribe to RSS Feed
- Permalink
- Report Inappropriate Content
Wow, you did provide fair warning, there's a lot to unwind here. Just on a high level, the very generous use of multiple append and joins forces the search and processing to occur in a certain sequential order which is likely the cause of the delay.
In particular, the join in your base search 2 would the first I would focus on. When using a join, the subsearch actually runs before the main search. See if this is the issue by deleting the join in your 2nd search and see how it impacts performance.
- Mark as New
- Bookmark Message
- Subscribe to Message
- Mute Message
- Subscribe to RSS Feed
- Permalink
- Report Inappropriate Content
I suspect most of the time is consumed by the browser building the visualization. To fix that, consider rewriting the dashboard using Splunk UI (React).
If this reply helps you, Karma would be appreciated.


