- Splunk Answers
- :
- Splunk Platform Products
- :
- Splunk Enterprise
- :
- Re: splunk forwarder is running but in Forwader:Ma...
- Subscribe to RSS Feed
- Mark Topic as New
- Mark Topic as Read
- Float this Topic for Current User
- Bookmark Topic
- Subscribe to Topic
- Mute Topic
- Printer Friendly Page
- Mark as New
- Bookmark Message
- Subscribe to Message
- Mute Message
- Subscribe to RSS Feed
- Permalink
- Report Inappropriate Content
Splunk forwarder is running but in Forwader:Management in MC is not active
Greetings!!
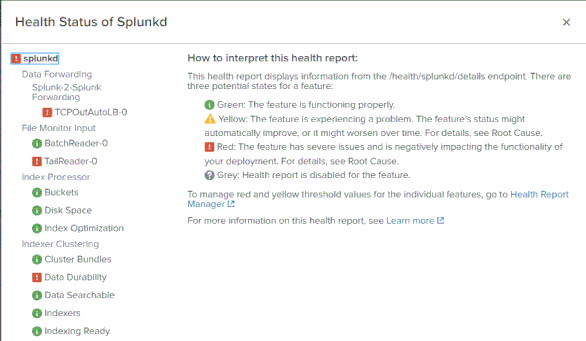
I'm getting the warning alerts showing me that splunk forwarder is not active, as shown on the below pic,
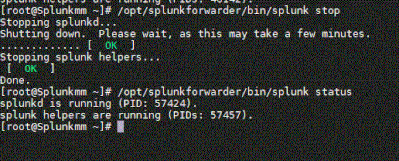
splunk forwarder is running (/opt/splunkforwarder/bin/splunk status
) but in Monitoring Console under Forwader:Management is not active it's showing a missing status,as shown on the above screenshot
even when I try to stop and restart the splunkforwader service(/opt/splunkforwarder/bin/splunk stop) can't be stopped, as shown on the below screenshot
Kindly help me on how i can fix the error,
Kindly help and guide me on how to fix this,
Thank you in advance.
- Mark as New
- Bookmark Message
- Subscribe to Message
- Mute Message
- Subscribe to RSS Feed
- Permalink
- Report Inappropriate Content
The second screenshot is not from the universal forwarder.
It seems you have problems forwarding the events to indexers. Question is why. Check the splunkd.log on each of those troublesome components and look for errors. Maybe network problems, maybe TLS issues...
- Mark as New
- Bookmark Message
- Subscribe to Message
- Mute Message
- Subscribe to RSS Feed
- Permalink
- Report Inappropriate Content
Dear @PickleRick ,
Search peer Splunkidx03 has the following message: Detecting bucket ID conflicts: idx=_internal, bid=_internal~518~B239BEEE-90FA-43C8-ADDA-620D3FACAB66, path1=/opt/splunk_data/indexes/_internaldb/db/518_B239BEEE-90FA-43C8-ADDA-620D3FACAB66, path2=/opt/splunk_data/indexes/_internaldb/db/db_1651988707_1651737547_518_B239BEEE-90FA-43C8-ADDA-620D3FACAB66. Temporally resolved by disabling the bucket: path=/opt/splunk_data/indexes/_internaldb/db/DISABLED-db_1651988707_1651737547_518_B239BEEE-90FA-43C8-ADDA-620D3FACAB66. Please check this disabled bucket for manual removal.
is the above error gives you more info on how you could advice me to fix the following error,
I checked on splunkd.log
05-22-2022 19:54:03.001 +0200 WARN TcpOutputProc - Applying quarantine to ip=x.x.x.13 port=9997 _numberOfFailures=2
05-22-2022 19:54:03.004 +0200 ERROR X509Verify - X509 certificate (O=SplunkUser,CN=SplunkServerDefaultCert) failed validation; error=10, reason="certificate has expired"
05-22-2022 19:54:03.004 +0200 WARN SSLCommon - Received fatal SSL3 alert. ssl_state='SSLv3 read server certificate B', alert_description='certificate expired'.
05-22-2022 19:54:03.004 +0200 ERROR TcpOutputFd - Connection to host=x.x.x..14:9997 failed. sock_error = 0. SSL Error = error:14090086:SSL routines:ssl3_get_server_certificate:certificate verify failed - please check the output of the `openssl verify` command for the certificates involved; note that if certificate verification is enabled (requireClientCert or sslVerifyServerCert set to "true"), the CA certificate and the server certificate should not have the same Common Name.
05-22-2022 19:54:03.004 +0200 WARN TcpOutputProc - Applying quarantine to ip=x.x.x.14 port=9997 _numberOfFailures=2
05-22-2022 19:54:03.007 +0200 ERROR X509Verify - X509 certificate (O=SplunkUser,CN=SplunkServerDefaultCert) failed validation; error=10, reason="certificate has expired"
05-22-2022 19:54:03.007 +0200 WARN SSLCommon - Received fatal SSL3 alert. ssl_state='SSLv3 read server certificate B', alert_description='certificate expired'.
05-22-2022 19:54:03.007 +0200 ERROR TcpOutputFd - Connection to host=x.x.x.15:9997 failed. sock_error = 0. SSL Error = error:14090086:SSL routines:ssl3_get_server_certificate:certificate verify failed - please check the output of the `openssl verify` command for the certificates involved; note that if certificate verification is enabled (requireClientCert or sslVerifyServerCert set to "true"), the CA certificate and the server certificate should not have the same Common Name.
05-22-2022 19:54:03.008 +0200 WARN TcpOutputProc - Applying quarantine to ip=x.x.x.15 port=9997 _numberOfFailures=2
05-22-2022 19:54:08.090 +0200 WARN TcpOutputProc - The TCP output processor has paused the data flow. Forwarding to output group primary_indexers has been blocked for 11520 seconds. This will probably stall the data flow towards indexing and other network outputs. Review the receiving system's health in the Splunk Monitoring Console. It is probably not accepting data.
05-22-2022 19:54:18.001 +0200 WARN TcpOutputProc - The TCP output processor has paused the data flow. Forwarding to output group primary_indexers has been blocked for 11530 seconds. This will probably stall the data flow towards indexing and other network outputs. Review the receiving system's health in the Splunk Monitoring Console. It is probably not accepting data.
05-22-2022 19:54:22.247 +0200 INFO CMBucket - set bucket summary bid=nc_fw_sophos~1265~A91B9781-86B7-4ECC-9DF2-D6C6F6B75A08 summaryId=F237DE98-1722-40E2-AA0E-9964094F7F12_DM_Splunk_SA_CIM_Web peer=9F50A957-648B-40D7-8B1D-CB8E511C8EA5 type=data_model state=done modtime=1653242047.000000 checksum=7E3C17CAACC1DD664BD299E51A27F53D508F1B1B49BB18AB41F56995DA0ACA03
05-22-2022 19:54:26.759 +0200 INFO ClientSessionsManager:Listener_AppEvents - Received count=9 AppEvents from DC ip=x.x.x.12 name=EF0E61E4-E613-4114-8794-822E03173A9C
With the above info, may you help me to understand more about the error and hw to fix it?
Thank you in advance!


