- Splunk Answers
- :
- Splunk Premium Solutions
- :
- Security Premium Solutions
- :
- Splunk Enterprise Security
- :
- Can you help me build a query which would generate...
- Subscribe to RSS Feed
- Mark Topic as New
- Mark Topic as Read
- Float this Topic for Current User
- Bookmark Topic
- Subscribe to Topic
- Mute Topic
- Printer Friendly Page
- Mark as New
- Bookmark Message
- Subscribe to Message
- Mute Message
- Subscribe to RSS Feed
- Permalink
- Report Inappropriate Content
Hey Guys,
Could anyone suggest me a query for the below scenario.
I need a Splunk query to show the list of enabled usecases in Enterprise Security App along with the last triggered time of the usecase.
To check the enabled usecases I'm using the below query.
| rest splunk_server=local count=0 /services/saved/searches
| search disabled=0 AND ( action.risk=1 OR action.notable=1 ) | table title
Along with this, I need the last triggered time of the use case in the same table.
Is it possible? if yes kindly help me by posting the query.
- Mark as New
- Bookmark Message
- Subscribe to Message
- Mute Message
- Subscribe to RSS Feed
- Permalink
- Report Inappropriate Content
you are half way there.
you can check the last time a notable was created by querying the "notable" index, many options here to do so, examples:
index = notable | dedup search_name | table search_name _time
index = notable | stats max(_time) as last_notable by search_name
note: pay attention also to the source field in the notable index.
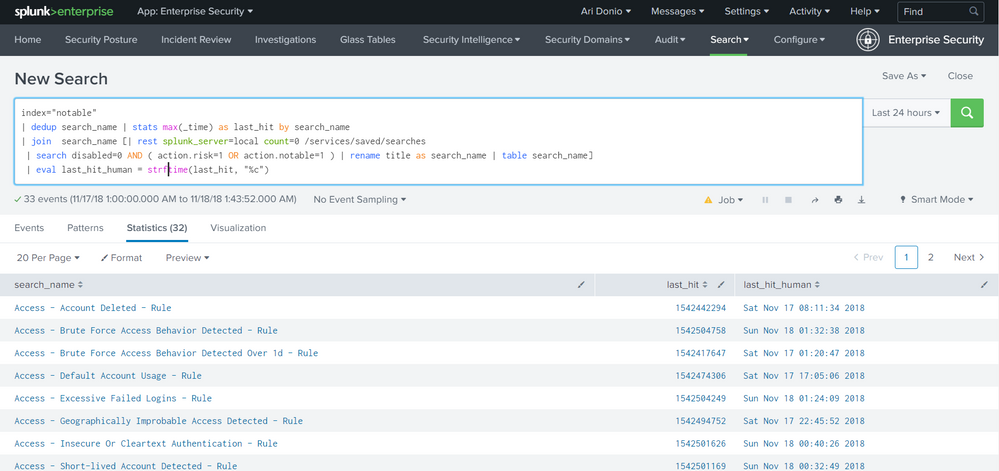
now all it takes is to put both queries together, again, many ways to go here too, here is one example with join:
index="notable"
| dedup search_name
| stats max(_time) as last_hit by search_name
| join  search_name [
                      | rest splunk_server=local count=0 /services/saved/searches
                      | search disabled=0 AND ( action.risk=1 OR action.notable=1 )
                      | rename title as search_name
                      | table search_name
                    ]
| eval last_hit_human = strftime(last_hit, "%c")
screenshot:
hope it helps
- Mark as New
- Bookmark Message
- Subscribe to Message
- Mute Message
- Subscribe to RSS Feed
- Permalink
- Report Inappropriate Content
This Works Perfect. Thanks @adonio
- Mark as New
- Bookmark Message
- Subscribe to Message
- Mute Message
- Subscribe to RSS Feed
- Permalink
- Report Inappropriate Content
when you say "triggered" do you mean the search was executed or you mean the search was executed and found a notable event?
- Mark as New
- Bookmark Message
- Subscribe to Message
- Mute Message
- Subscribe to RSS Feed
- Permalink
- Report Inappropriate Content
I mean the time when the search was executed and the notable was created.

