- Splunk Answers
- :
- Using Splunk
- :
- Reporting
- :
- Network Toolkit : ping status for Multiple IP in d...
- Subscribe to RSS Feed
- Mark Topic as New
- Mark Topic as Read
- Float this Topic for Current User
- Bookmark Topic
- Subscribe to Topic
- Mute Topic
- Printer Friendly Page
- Mark as New
- Bookmark Message
- Subscribe to Message
- Mute Message
- Subscribe to RSS Feed
- Permalink
- Report Inappropriate Content
Network Toolkit : ping status for Multiple IP in different columns ?
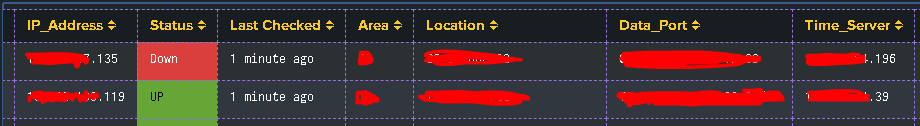
I am using Network Toolkit app for pinging some of my servers and getting the status as "Down" or "UP" and using lookup file I am showing other details of that server such as Area, Location, Data_Port and Time_server. But along with this, I have to show the ping status of "Time_Server" also into the same table panel. I don't want to create separate panels for Time Server health status. Attaching screenshot for your reference, so basically there should be one more column named "Time_Server_Status" showing "Down" or "UP" at the end of the table ?
I have installed Network Toolkit app on HF and collecting the data into my index, the server ping is getting collected as sourcetype "ping", and I am also collecting ping status for Time_Server IPs in different sourcetype as timeserver_ping. In our environment, I want to monitor 200 server IPs and 10 Time_Server IPs, and I am using lookup file to show all the details as mentioned above. Hence, how can I show both Server and Time_Server IP ping status in the same table ? Please advise ?
- Mark as New
- Bookmark Message
- Subscribe to Message
- Mute Message
- Subscribe to RSS Feed
- Permalink
- Report Inappropriate Content
You can first search for both the data sources, lets say you have sourc1 for ping status of servers and source2 for ping status of time_server
source1 OR source2 | then your search and apply lookup.
If this helps, give a like below.
- Mark as New
- Bookmark Message
- Subscribe to Message
- Mute Message
- Subscribe to RSS Feed
- Permalink
- Report Inappropriate Content
@thambisetty - even if I search both sources, showing Server_IP and Time_Server_IP will be problem, as I have 200 Server_IPs and only 10 Time_Server_IP. Actually, some Server_IPs (for eg 50 Server_IPs point to one Time_Server_IP), hence, showing the status will actually not work after taking from the lookup ? hope you got it ?
- Mark as New
- Bookmark Message
- Subscribe to Message
- Mute Message
- Subscribe to RSS Feed
- Permalink
- Report Inappropriate Content
I am using Network Toolkit app for pinging some of my servers and getting the status as "Down" or "UP" and using lookup file I am showing other details of that server such as Area, Location, Data_Port and Time_server.
The above you have already got as per the screenshot you have attached. next - >
your search
| append [| index=indexwhereyourtimeserver_pingdetails sourcetype=timeserver_ping | table time_server_ip ping_status]
| stats values(*) as * by time_server_ip
Note: the time_server_ip from your search results and timeserver_ping should match to combine results and show in single table.
hope this helps. upvote if this solves your problem
If this helps, give a like below.
- Mark as New
- Bookmark Message
- Subscribe to Message
- Mute Message
- Subscribe to RSS Feed
- Permalink
- Report Inappropriate Content
ok i will check the query and get back to you.
ICYMI - Check out the latest releases of Splunk Edge Processor
Introducing the 2024 SplunkTrust!
Introducing the 2024 Splunk MVPs!
