- News & Education
- :
- Blog & Announcements
- :
- Product News & Announcements
- :
- New Splunk APM Enhancements Help Troubleshoot Your...
New Splunk APM Enhancements Help Troubleshoot Your MySQL and NoSQL Databases Faster
- Subscribe to RSS Feed
- Mark as New
- Mark as Read
- Bookmark Topic
- Subscribe
- Printer Friendly Page
- Report Inappropriate Content
Splunk Observability has two new enhancements to make it quicker and easier to troubleshoot slow or frequently executed queries in MySQL and NoSQL databases. First, Splunk users can now monitor and troubleshoot their NoSQL databases, starting with Redis, with no additional setup required. Next, we’ve added helpful context between the performance of hosts or instances in Infrastructure Monitoring, and database query performance in Application Performance Monitoring (APM). Along with Splunk Synthetic Monitoring, Splunk RUM, Splunk Log Observer, and Splunk On-Call, these enhancements help engineers detect, troubleshoot, and resolve problems faster.
Troubleshooting Redis With Database Correlations
Starting with Redis, Splunk now supports NoSQL database monitoring and troubleshooting. Engineers can resolve bottlenecks from latency, request rate, or errors in Redis databases, and understand which instance or command was the cause.
Here’s a quick example of troubleshooting a Redis instance with the use of database correlations:
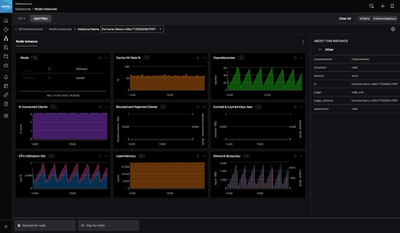
An SRE receives an alert for a spike in CPU utilization rate within a Redis instance. They review Redis performance metrics in Splunk Infrastructure Monitoring and notice spikes in ‘operations per second,’ ‘CPU utilization,’ and ‘network bytes per second’ after a recent deployment.
While Infrastructure Monitoring provides some initial detail for the SRE, Splunk now offers database correlations from related content at the bottom of the UI. The tiles, “Queries for Redis,” navigate to the slowest and most frequently executed queries, while “Map for Redis,” will navigate the user to a birdseye view of the database and all of its dependencies.
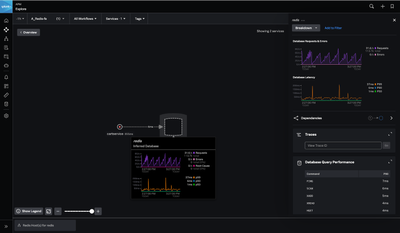
The SRE first clicks the ‘Map for Redis’ tile. They confirm the database is performing high requests to the ‘cartservice’. From here the SRE wants to find which command is performing abnormally, and they can explore further by expanding the ‘database query performance’ tile.
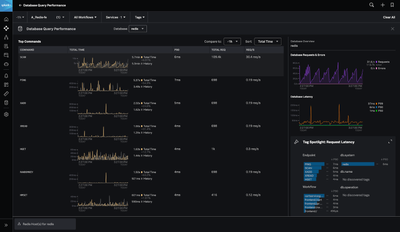
Alternatively, the SRE can click “Queries for Redis,” and use Splunk APM to identify the specific commands that are driving the spikes in query performance.
APM’s Redis command performance surfaces the top commands by latency, request rate, and total time. For this Redis instance, the SRE sees that ‘SCAN’ commands are experiencing high request rate, which correlates with the spike found in Splunk Infrastructure Monitoring.
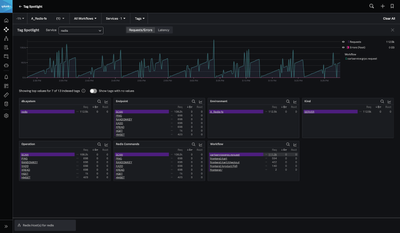
The SRE then uses tag spotlight and finds that Cartservice:grpc.request has 113,000 requests per second, and scope the additional impact of the problem across their workflows.
From here, the SRE can effectively communicate the performance problems with the ‘Cart service’ and ‘cartservice:grpc.request’ workflow, and their SCAN commands to their database administrators or service owners.
Splunk Observability for MySQL and NoSQL Database Performance
For database performance, Splunk provides an end to end troubleshooting experience with enough information to understand the source of slowness, and helpful context to help SREs communicate with DBAs as they troubleshoot. Out of the box capabilities connect client side metrics to database performance, and help engineers quickly jump from Splunk Infrastructure Monitoring to APM. There is no additional cost for these additional database features in Splunk O11y. For Splunk users focused on Open Telemetry standards, so there will be no custom instrumentation overhead.
Try it Today!
It’s now easier than ever to troubleshoot slow or frequently executed queries in MySQL and NoSQL databases, with no additional setup required. Getting started with Splunk APM or Infrastructure Monitoring will provide deep visibility into your databases and infrastructure. Read the docs, or get started with Infrastructure Monitoring and APM, today!
— Mat Ball, Director of Product Marketing, Observability
You must be a registered user to add a comment. If you've already registered, sign in. Otherwise, register and sign in.
Routing logs with Splunk OTel Collector for Kubernetes
Welcome to the Splunk Community!
Tech Talk | Elevating Digital Service Excellence: The Synergy of Splunk RUM & APM
-
Customer Experience
9 -
Data Stream Processor
1 -
Edge Processor
2 -
OpenTelemetry
1 -
other
7 -
Splunk APM
19 -
Splunk Cloud Platform
61 -
Splunk Enterprise
44 -
Splunk Enterprise Security
43 -
Splunk Infras Monitoring
16 -
Splunk ITSI
11 -
Splunk Mission Control
4 -
Splunk Observability Cloud
75 -
Splunk On-Call
2 -
Splunk Security Cloud
21 -
Splunk SOAR
15 -
Splunk UBA
2 -
Splunkbase Apps & Add-Ons
16


