- News & Education
- :
- Blog & Announcements
- :
- Product News & Announcements
- :
- Announcing the General Availability of Synthetic M...
Announcing the General Availability of Synthetic Monitoring Within Splunk Observability!
- Subscribe to RSS Feed
- Mark as New
- Mark as Read
- Bookmark Topic
- Subscribe
- Printer Friendly Page
- Report Inappropriate Content
We’re proud to announce the general availability of best-in-class Synthetic Monitoring capabilities within Splunk Observability Cloud. Now, IT and engineering teams can proactively measure, monitor and troubleshoot their critical user flows, APIs and services, connected across Splunk Observability.
With the GA of Splunk Synthetic Monitoring, customers can leverage the following synthetic test types to baseline and measure the uptime, performance and functionality of their web applications and web services from 22 locations globally:
- Browser Tests proactively simulate critical user flows using modern Chrome browsers.
- API Tests monitor end-to-end workflows by chaining HTTP requests and API calls.
- Uptime Tests easily test the availability and response time of your webpages and key endpoints.
Prior to this launch, users accessed Splunk Synthetic Monitoring as a separate application and UI. Now, they can access their synthetics solution within the Observability Cloud using a common login, user experience, and computation engine. The new experience ingests synthetic data natively, where users can leverage Splunk Observability Cloud’s best-in-class analytics, alerting, incident intelligence, dashboarding, and reporting capabilities. As a result, users have more intelligent alerting on their synthetic data, reducing alert fatigue and lightening the burden on SREs and Operations teams. With intelligent triage and more automation for cross-product troubleshooting, DevOps teams are better positioned to operate increasingly complex systems with less downtime for end users.
Troubleshooting the Browser Experience End-to-End with Splunk Synthetic Monitoring
Splunk Synthetic Monitoring’s tests can be configured to proactively monitor digital experience as frequently as every minute. Here are two examples of how Splunk Synthetic Monitoring can help identify and isolate the root cause of production issues:
Workflow One: Troubleshooting Performance Problems
Splunk Synthetic Monitoring proactively monitors your business-critical user flows from the outside in to give you a complete view of every component that impact’s your end-user experience. Splunk Synthetic Monitoring has the data you need to isolate issues faster.
Here we see Splunk Synthetic Monitoring identify a performance regression in the load duration of the homepage of an e-commerce website.
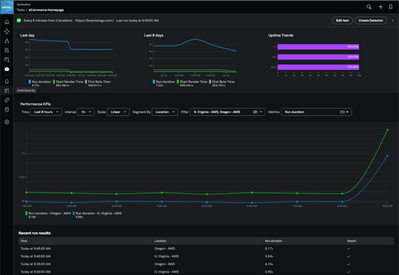
By clicking the first elevated datapoint in the graph, we can access the details of a specific synthetic test run. This page contains helpful information we can use to troubleshoot, including: qualitative metrics about the page’s size, composition, and total number of errors; a waterfall chart of network activity experience in the browser; and a video of the entire simulated session.
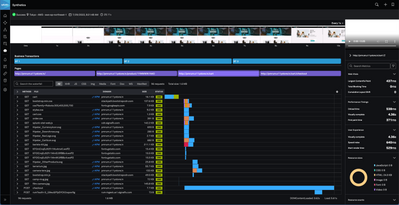
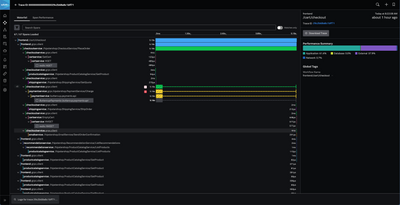
We can easily see that the regression occurred on the POST request fetching data from our backend service. For any issues related to backend services, we can simply click the “APM” link from the waterfall to show backend service performance and further isolate the issue’s root cause.
Workflow Two: Identifying An Outage Related to a Third Party API Service
In today’s digital world, applications are increasingly decentralized, with critical functionality often being provided by third-party services over which website admins or app developers have limited control.
For example, an e-commerce business might leverage a service provided by a logistics company such as UPS or FedEx during their checkout process to calculate the appropriate shipping fee for an order. If that service goes down, users won’t be able to process their order, directly impacting the e-commerce company’s business performance.
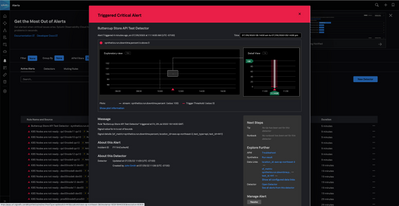
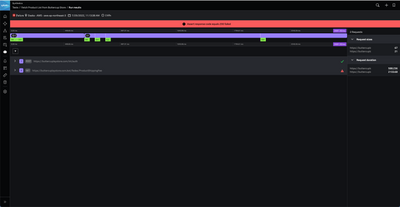
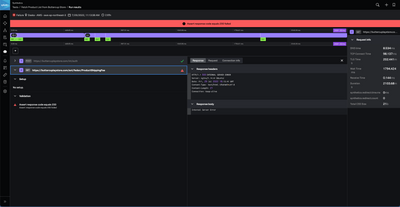
With Splunk Synthetic Monitoring, you can configure an API test that alerts you the moment that a key service goes down. Here we have received an alert that a specific API test failed.
We click the link in the bottom right-hand corner of that modal to access results for the API test run which triggered the alert. Once here, we find that this API test failed when it attempted an HTTP GET request to this service. In the results, we can see in the response body that the service returned a 500 status code.
Synthetic Monitoring Within Splunk Observability Cloud
By integrating Synthetic Monitoring in Splunk Observability, IT and engineering teams can quickly set up tests to baseline the end-user experience, measure SLAs, and report on application uptime. With native cross-product integrations, users will also be able to reduce their mean time to resolution and focus their efforts on delivering market-leading features.
While the standalone Splunk Synthetic Monitoring offering (formerly known as Rigor) is still available, Splunk will continue to migrate all feature capabilities, including industry-leading Web Optimization capabilities, in the near future.
Try it Today!
If you’re interested in testing out any of the workflows and functionality described above, please sign up for a trial to get started or take a look at our docs!
— Mat Ball, Director of Product Marketing, Observability
You must be a registered user to add a comment. If you've already registered, sign in. Otherwise, register and sign in.
Extending Observability Content to Splunk Cloud
More Control Over Your Monitoring Costs with Archived Metrics!
New in Observability Cloud - Explicit Bucket Histograms
-
Customer Experience
9 -
Data Stream Processor
1 -
Edge Processor
2 -
OpenTelemetry
1 -
other
7 -
Product Announcements
1 -
Splunk APM
20 -
Splunk Cloud Platform
61 -
Splunk Community
1 -
Splunk Enterprise
45 -
Splunk Enterprise Security
43 -
Splunk Infras Monitoring
17 -
Splunk ITSI
11 -
Splunk Lantern
1 -
Splunk Mission Control
4 -
Splunk Observability Cloud
78 -
Splunk On-Call
2 -
Splunk Security Cloud
21 -
Splunk SOAR
15 -
Splunk UBA
2 -
Splunkbase Apps & Add-Ons
16 -
User Groups
1
- « Previous
- Next »
