- Splunk Answers
- :
- Splunk Administration
- :
- Monitoring Splunk
- :
- Re: splunk suddenly stoped working and don't now h...
- Subscribe to RSS Feed
- Mark Topic as New
- Mark Topic as Read
- Float this Topic for Current User
- Bookmark Topic
- Subscribe to Topic
- Mute Topic
- Printer Friendly Page
- Mark as New
- Bookmark Message
- Subscribe to Message
- Mute Message
- Subscribe to RSS Feed
- Permalink
- Report Inappropriate Content
hello all
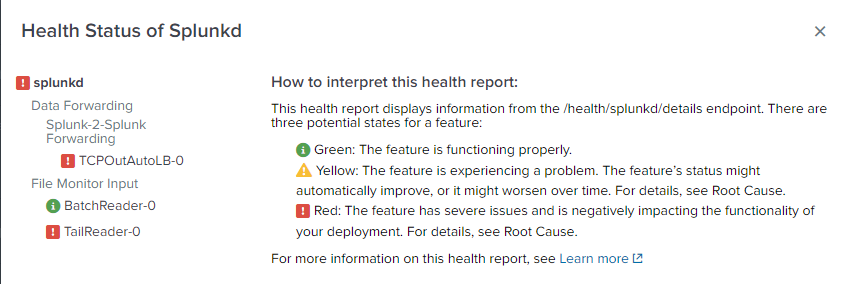
splunk has stopped working since 2 days ago with these errors
please help me
thanks in advance
- Mark as New
- Bookmark Message
- Subscribe to Message
- Mute Message
- Subscribe to RSS Feed
- Permalink
- Report Inappropriate Content
Hi @NimaBokhar,
Have a look here, this contains the full description of all health check items :
https://docs.splunk.com/Documentation/Splunk/7.2.6/DMC/Aboutfeaturemonitoring
And a guide to configure the statuses you want to keep here : https://docs.splunk.com/Documentation/Splunk/7.2.6/DMC/Configurefeaturemonitoring
In your case the TCPout is red meaning that this splunk server is not able to forward its log and this therefore drags the tailreader down with it because since there is nowhere to send the logs to then new log files cant be read. If you click on any of the red elements you should get logs pointing at what destinations cant be forwarded to and you can take the troubleshooting off from there.
Cheers,
David
- Mark as New
- Bookmark Message
- Subscribe to Message
- Mute Message
- Subscribe to RSS Feed
- Permalink
- Report Inappropriate Content
thanks, David
but this is a stand-alone server and only collect logs from other devices how can it try to send logs where ever
this is the screenshot from TCPOutAutoLB:

- Mark as New
- Bookmark Message
- Subscribe to Message
- Mute Message
- Subscribe to RSS Feed
- Permalink
- Report Inappropriate Content
Screenshot is not showing, can you copy some of the tcpoutautolb logs ?
- Mark as New
- Bookmark Message
- Subscribe to Message
- Mute Message
- Subscribe to RSS Feed
- Permalink
- Report Inappropriate Content
sorry, David fixed the screenshot but here are some of the logs:
TCPOutAutoLB-0
Root Cause: More than 70% of forwarding destinations have failed. Ensure your hosts and ports in outputs.conf are correct. Also ensure that the indexers are all running, and that any SSL certificates being used for forwarding are correct.
Last 50 related messages:
05-25-2019 12:18:58.909 +0430 WARN TcpOutputProc - Tcpout Processor: The TCP output processor has paused the data flow. Forwarding to output group default-autolb-group has been blocked for 8150 seconds. This will probably stall the data flow towards indexing and other network outputs. Review the receiving system's health in the Splunk Monitoring Console. It is probably not accepting data.
05-25-2019 12:18:48.853 +0430 WARN TcpOutputProc - Tcpout Processor: The TCP output processor has paused the data flow. Forwarding to output group default-autolb-group has been blocked for 8140 seconds. This will probably stall the data flow towards indexing and other network outputs. Review the receiving system's health in the Splunk Monitoring Console. It is probably not accepting data.
05-25-2019 12:18:38.798 +0430 WARN TcpOutputProc - Tcpout Processor: The TCP output processor has paused the data flow. Forwarding to output group default-autolb-group has been blocked for 8130 seconds. This will probably stall the data flow towards indexing and other network outputs. Review the receiving system's health in the Splunk Monitoring Console. It is probably not accepting data.
- Mark as New
- Bookmark Message
- Subscribe to Message
- Mute Message
- Subscribe to RSS Feed
- Permalink
- Report Inappropriate Content
Hi @NimaBokhar, yeah this is what I thought, please read my previous comment, seems like you're forwarding data nowhere. If this server is not forwarding data you should remove any forwarding configuration. Check for any outputs.conf in your apps that could be active. Also use : $SPLUNK_HOME$/bin/splunk btool outputs list --debug | grep default-autolb-group this will point you to the file containing the corrupt configuration.
Cheers,
David
- Mark as New
- Bookmark Message
- Subscribe to Message
- Mute Message
- Subscribe to RSS Feed
- Permalink
- Report Inappropriate Content
thanks man that worked like a charm.
- Mark as New
- Bookmark Message
- Subscribe to Message
- Mute Message
- Subscribe to RSS Feed
- Permalink
- Report Inappropriate Content
Awesome man 😉 glad I could help
- Mark as New
- Bookmark Message
- Subscribe to Message
- Mute Message
- Subscribe to RSS Feed
- Permalink
- Report Inappropriate Content
appreciate it 😉
- Mark as New
- Bookmark Message
- Subscribe to Message
- Mute Message
- Subscribe to RSS Feed
- Permalink
- Report Inappropriate Content
Okay, now it's working. Look in your config files on that Splunk for an outputs.conf file that contains the following output group default-autolb-group. It seems like you have log forwarding enabled but it's pointing nowhere. If it's a standalone and no where to send the logs to then you will have to get rid of this configuration.

