- Find Answers
- :
- Splunk Administration
- :
- Monitoring Splunk
- :
- How to write a query which shows a graph for used ...
- Subscribe to RSS Feed
- Mark Topic as New
- Mark Topic as Read
- Float this Topic for Current User
- Bookmark Topic
- Subscribe to Topic
- Mute Topic
- Printer Friendly Page
- Mark as New
- Bookmark Message
- Subscribe to Message
- Mute Message
- Subscribe to RSS Feed
- Permalink
- Report Inappropriate Content
Hi,
We are having a Splunk Enterprise app and we would like to know that, is there any way we can write a query which shows a graph for used storage per month ?
The idea behind that is, whether we move to Splunk Cloud by seeing the statistics provide by the above query.
Thanks
- Mark as New
- Bookmark Message
- Subscribe to Message
- Mute Message
- Subscribe to RSS Feed
- Permalink
- Report Inappropriate Content
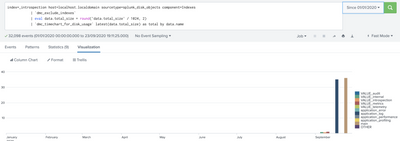
I think I found the query that I need.
You have to run this in Splunk monitoring console search (Ex. http://your-splunk-server:port/en-GB/app/splunk_monitoring_console/search) not the default search (Ex. http://your-splunk-server:port/en-GB/app/search/search )
index=_introspection host=localhost.localdomain sourcetype=splunk_disk_objects component=Indexes
            | `dmc_exclude_indexes`
            | eval data.total_size = round('data.total_size' / 1024, 2)
            | `dmc_timechart_for_disk_usage` latest(data.total_size) as total by data.name
Which gives output like below which is I needed.
- Mark as New
- Bookmark Message
- Subscribe to Message
- Mute Message
- Subscribe to RSS Feed
- Permalink
- Report Inappropriate Content
Other good shortcut is Ctrl+F / Cmd+F which auto format command line.
r. Ismo
- Mark as New
- Bookmark Message
- Subscribe to Message
- Mute Message
- Subscribe to RSS Feed
- Permalink
- Report Inappropriate Content
There are multiple ways. the simplest one is thru DMC - the distributed management console.
May we know if you checked the DMC license usage reports please.
There are lot of SPL search queries available to get detailed reports by indexer, by pool, by date, by host, etc. Maybe you can first check the DMC and update more info about your requirements. thanks.
(i have given around 300 karma points so far,.. maybe you also give karma points if a post helped you, thx)
- Mark as New
- Bookmark Message
- Subscribe to Message
- Mute Message
- Subscribe to RSS Feed
- Permalink
- Report Inappropriate Content
@inventsekar we are using Splunk version 8.0.1. As I read, DMC now called as Monitoring Console
In that case we are using DMC or the Monitoring Console. But when I go inside that I don't have any data for Disk Usage
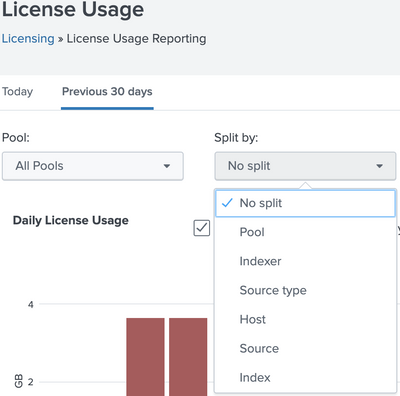
Under the License Usage I can see the Split option that you have mentioned. But that is not my current requirement.
What I need is to get an understanding how much disk space (physical hard drive) has been filled per month for the last year because of the data that we are feeding to the Splunk.
Thanks
- Mark as New
- Bookmark Message
- Subscribe to Message
- Mute Message
- Subscribe to RSS Feed
- Permalink
- Report Inappropriate Content
Do you have single instance or distributed environment?
If single then just go to settings -> select single -> check and edit server roles if needed and apply settings. After that MC (Monitoring Console, current name of DMC) is usable and those reports should work.
If you have distributed environment then you must read how and where you could and should install and configure MC. See https://docs.splunk.com/Documentation/Splunk/8.0.6/DMC/DMCprerequisites
DON't install it another nodes as described in the above doc!
r. Ismo


