- Splunk Answers
- :
- Splunk Administration
- :
- Getting Data In
- :
- Re: Wildly conflicting timestamps for events
- Subscribe to RSS Feed
- Mark Topic as New
- Mark Topic as Read
- Float this Topic for Current User
- Bookmark Topic
- Subscribe to Topic
- Mute Topic
- Printer Friendly Page
- Mark as New
- Bookmark Message
- Subscribe to Message
- Mute Message
- Subscribe to RSS Feed
- Permalink
- Report Inappropriate Content
We are logging OS events with the Nix app on our universal forwarders. As you can see from the attached output, the events are from the exact same host, on the same indexer, from the exact same context, but the timestamps are all wildly different, some of which are set into the future by quite a few years... I've sshed into the box in question and the system clock is correct and the filesystem where these binaries are all correct.
Ive tried setting the MAX_DAYS_HENCE and MAX_DAYS_AGO to 10,000,000, but i still get these warnings. We've considered filtering this log to FATAL level and above, but we'd rather get other WARN level logs if they occur...
Any insight would be greatly appreciated.
tail -f /opt/splunk/var/log/splunk/splunkd.log | grep someHostName

03-12-2012 22:01:30.307 +0000 WARN  DateParserVerbose - Accepted time (Mon Jan 18 01:54:00 2010) is suspiciously far away from the previous event's time (Fri Dec 10 02:23:00 2010), but still accepted because it was extracted by the same pattern.  Context="source::top|host::someHostName|top|remoteport::31870"

03-12-2012 22:01:30.307 +0000 WARN  DateParserVerbose - Accepted time (Tue Jan 26 02:04:00 2010) is suspiciously far away from the previous event's time (Sun Jan 10 01:33:00 2010), but still accepted because it was extracted by the same pattern.  Context="source::top|host::someHostName|top|remoteport::31870"

03-12-2012 22:01:30.307 +0000 WARN  DateParserVerbose - Accepted time (Sat Jan 30 04:13:00 2010) is suspiciously far away from the previous event's time (Mon Jan 18 01:54:00 2010), but still accepted because it was extracted by the same pattern.  Context="source::top|host::someHostName|top|remoteport::31870"

03-12-2012 22:01:30.308 +0000 WARN  DateParserVerbose - Accepted time (Fri Jul 15 02:21:00 2016) is suspiciously far away from the previous event's time (Tue Jan 26 02:04:00 2010), but still accepted because it was extracted by the same pattern.  Context="source::top|host::someHostName|top|remoteport::31870"

03-12-2012 22:01:30.308 +0000 WARN  DateParserVerbose - Accepted time (Mon May 29 12:18:00 2017) is suspiciously far away from the previous event's time (Sat Jan 30 04:13:00 2010), but still accepted because it was extracted by the same pattern.  Context="source::top|host::someHostName|top|remoteport::31870"

03-12-2012 22:01:30.308 +0000 WARN  DateParserVerbose - A possible timestamp match (Fri Jul 15 02:21:00 2016) is outside of the acceptable time window. If this timestamp is correct, consider adjusting MAX_DAYS_AGO and MAX_DAYS_HENCE.  Context="source::top|host::someHostName|top|remoteport::31870"

03-12-2012 22:01:30.308 +0000 WARN  DateParserVerbose - Failed to parse timestamp. Defaulting to timestamp of previous event.  Context="source::top|host::someHostName|top|remoteport::31870" Text=" 16197  root              15     0   10104     772     616   S     0.0     0.0       2:21.15  syslog..."
03-12-2012 22:01:30.308 +0000 WARN  DateParserVerbose - A possible timestamp match ( 17153 ) is outside of the acceptable time window. If this timestamp is correct, consider adjusting MAX_DAYS_AGO and MAX_DAYS_HENCE.  Context="source::top|host::someHostName|top|remoteport::31870"

03-12-2012 22:01:30.309 +0000 WARN  DateParserVerbose - A possible timestamp match ( 17149 ) is outside of the acceptable time window. If this timestamp is correct, consider adjusting MAX_DAYS_AGO and MAX_DAYS_HENCE.  Context="source::top|host::someHostName|top|remoteport::31870"
- Mark as New
- Bookmark Message
- Subscribe to Message
- Mute Message
- Subscribe to RSS Feed
- Permalink
- Report Inappropriate Content
SOLVED:
We weren't running the Unix app on the indexers. The fix you gave me, lguinn, worked (I just had to fix the script path and set the disabled flag to 0 😉 ).
By installing the Unix app on the indexer, the issue solved itself.
Thanks all for your input!
- Mark as New
- Bookmark Message
- Subscribe to Message
- Mute Message
- Subscribe to RSS Feed
- Permalink
- Report Inappropriate Content
You should look at how the Splunk NIX appsets things up. It has a script called **top.sh* that is run every minute. The script runs top and then massages the data slightly so it will be easier to work with in Splunk. The script is invoked by inputs.conf, and there are also some props.conf settings. Here are the relevant parts of the files:
inputs.conf (goes on the forwarder)
[script://./bin/top.sh]
interval = 60
sourcetype = top
source = top
index = os
disabled = 1
props.conf (goes on the indexers)
[top]
SHOULD_LINEMERGE=false
LINE_BREAKER=^()$
TRUNCATE=1000000
DATETIME_CONFIG = CURRENT
Hope this helps... I think if you just copy that stanze in props.conf to the indexer(s), all will be well.
- Mark as New
- Bookmark Message
- Subscribe to Message
- Mute Message
- Subscribe to RSS Feed
- Permalink
- Report Inappropriate Content
Yes, absolutely.
- Mark as New
- Bookmark Message
- Subscribe to Message
- Mute Message
- Subscribe to RSS Feed
- Permalink
- Report Inappropriate Content
does this same patters apply to vmstat and the other sh scripts
- Mark as New
- Bookmark Message
- Subscribe to Message
- Mute Message
- Subscribe to RSS Feed
- Permalink
- Report Inappropriate Content
From just a quick look, it seems that you are indexing top output, right?
Could it be possible that splunk parses each individual line of the top "table" as a separate event, and tries to find a timestamp inside each line? (i.e. try to parse the PID etc as timestamp information)
How do the events look in your actual index (not in the splunkd.log)?
If events are looking ugly - you should probably look at how you do your linebreaking in props.conf.
UPDATE:
Not too familiar with the nix app. In order to check if there is something wrong with the linebreaking for top, you could look in the regular search app with a search along the lines of
sourcetype=top host=yourHost linecount=1
If you get any results back, that would indicate that the data returned from top.sh does indeed get broken into one event per line, rather than being treated as a multiline event. From the look of your timestamping errors (splunk trying to parse 17121, 12321 and similar values as time, along with the one message that actually mentions the syslog process), I'm inclined to think that this is the case.
UPDATE 2:
Yeah, well, hmm. This config is most likely set in a separate props.conf file within the nix app, as you know you can have several props.conf files (which are merged at runtime - sort of). However, I'm no expert on the *nix app, so I'm not a 100% sure about the separate props.conf
Do you have this app installed on several hosts? Same flavour of *nix? Or more correctly, does the top output look the same on all hosts with regard to the beginning an end of the list of processes (i.e the stuff that you break events on)? I don't mean within Splunk, but rather what it looks like in a shell.
If you have a Heavy/Full forwarder, that's where you'd want to change the props.conf, if you have a Universal Forwarder you'd want to change it on the indexer.
Aah I just saw that Lisa posted a suggestion below. Have you tried that?
Hope this helps,
Kristian
- Mark as New
- Bookmark Message
- Subscribe to Message
- Mute Message
- Subscribe to RSS Feed
- Permalink
- Report Inappropriate Content
You're right! There is an event per line! Any ideas on how to change the extractor in the conf files?
- Mark as New
- Bookmark Message
- Subscribe to Message
- Mute Message
- Subscribe to RSS Feed
- Permalink
- Report Inappropriate Content
We're using the Splunk Nix app, but yes it uses top.sh among others. That is an interesting idea, but the search head shows the top event as follows:
http://i1079.photobucket.com/albums/w512/nterry_dev/screencapture.jpg
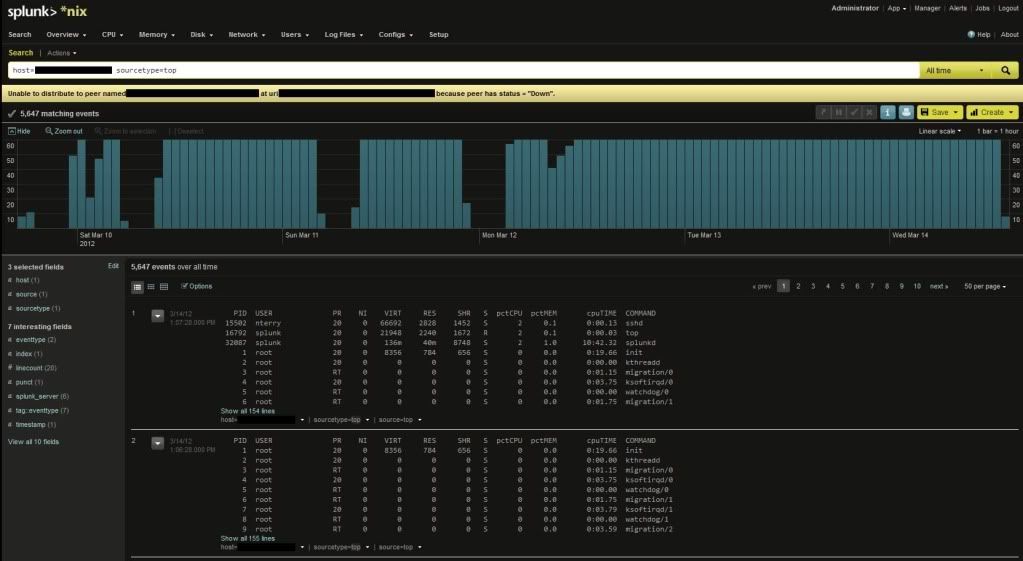
I have confirmed that the host this is pulled from is generating the warning
- Mark as New
- Bookmark Message
- Subscribe to Message
- Mute Message
- Subscribe to RSS Feed
- Permalink
- Report Inappropriate Content
Parsing of timestamps will be done on a heavy forwarder or an Indexer. If you're using a UF, put the settings on your indexer. Otherwise, put it on your HWF.
- Mark as New
- Bookmark Message
- Subscribe to Message
- Mute Message
- Subscribe to RSS Feed
- Permalink
- Report Inappropriate Content
You probably need to configure time stamp recognition to tell Splunk how it should interpert the time stamps of your events. Sometimes Splunk guesses about the time stamp incorrectly, and its difficult to determine why things are going badly. Instead of worrying about why, it's better to move on with fixing the problem by defining by using TIME_FORMAT, and MAX_TIMESTAMP_LOOKAHEAD in props.conf. I've also found TIME_PREFIX to be useful.
http://docs.splunk.com/Documentation/Splunk/latest/Data/Configuretimestamprecognition
- Mark as New
- Bookmark Message
- Subscribe to Message
- Mute Message
- Subscribe to RSS Feed
- Permalink
- Report Inappropriate Content
I then tried to spew the events to a file on a heavy forwarder, but I realized that this would only tell me one of two things, either the error was occurring at the univ. forwarder or the heavy forwarder, or neither of them. This doesnt help me...
Does anybody have any other ides?
- Mark as New
- Bookmark Message
- Subscribe to Message
- Mute Message
- Subscribe to RSS Feed
- Permalink
- Report Inappropriate Content
Still no good.... the indexers are giving this warning only on some of the boxes, and thos flags are universally applied.
Ive tried everything that I can possible think of. For diagnosing the tissue, I wanted to know if the universal forwarder was messing up the timestamp, so i set up an rsyslog daemon and tried to configure it according to the outputs.conf docs here: http://docs.splunk.com/Documentation/Splunk/latest/Admin/Outputsconf. Apparently, you cannot use transforms.conf and props.conf on the universal forwarder, so I cant view the events that are spewed from it, on the computer.
- Mark as New
- Bookmark Message
- Subscribe to Message
- Mute Message
- Subscribe to RSS Feed
- Permalink
- Report Inappropriate Content
Where is the timestamp parsing done? Is it done with the univeral forwarder or with a heavy forwarder? Hw do I modify it?
- Mark as New
- Bookmark Message
- Subscribe to Message
- Mute Message
- Subscribe to RSS Feed
- Permalink
- Report Inappropriate Content
I'm guessing you have incorrect time stamp parsing. You probably need to look at that particular source and check for data that looks like a timestamp (usually epoch looking).
- Mark as New
- Bookmark Message
- Subscribe to Message
- Mute Message
- Subscribe to RSS Feed
- Permalink
- Report Inappropriate Content
The events are there in the log i posted... Look at the timestamps and the Context info... All the contexts are identical and the timestamps are different. All of these events happened consecutively.
- Mark as New
- Bookmark Message
- Subscribe to Message
- Mute Message
- Subscribe to RSS Feed
- Permalink
- Report Inappropriate Content
Can you show examples of the timestamps from the actual events - including both some timestamps interpreted correctly and those that were incorrect? A copy of a few lines of the input or log would be even better. (With names obfuscated, of course.) The error messages are interesting, but I can't really diagnose without seeing the data that caused these messages...
Welcome to the Splunk Community!
Tech Talk | Elevating Digital Service Excellence: The Synergy of Splunk RUM & APM
Adoption of RUM and APM at Splunk
