
Join the Conversation
- Find Answers
- :
- Splunk Administration
- :
- Getting Data In
- :
- Need to schedule IO wait alerts on Splunk
- Subscribe to RSS Feed
- Mark Topic as New
- Mark Topic as Read
- Float this Topic for Current User
- Bookmark Topic
- Subscribe to Topic
- Mute Topic
- Printer Friendly Page
- Mark as New
- Bookmark Message
- Subscribe to Message
- Mute Message
- Subscribe to RSS Feed
- Permalink
- Report Inappropriate Content
Need to schedule IO wait alerts on Splunk

Our Splunk infrastructure is on Azure and recently we face a major issue where I/O wait time was high and so indexing and all the data pipeline queues were effected.
Now we have decided as an RCA item to schedule the IO wait time alerts on the infrastructure so that we can know if there something wrong in our splunk config or it is an Azure storage which is piling up the data pipeline queues.
Please let us know now can we schedule IO alerts on Splunk.
Thanks.
Vikram.
- Mark as New
- Bookmark Message
- Subscribe to Message
- Mute Message
- Subscribe to RSS Feed
- Permalink
- Report Inappropriate Content

hello there, i might be off with my answer but thought its worthwhile to bring to your attention and need the answer to post screenshots.
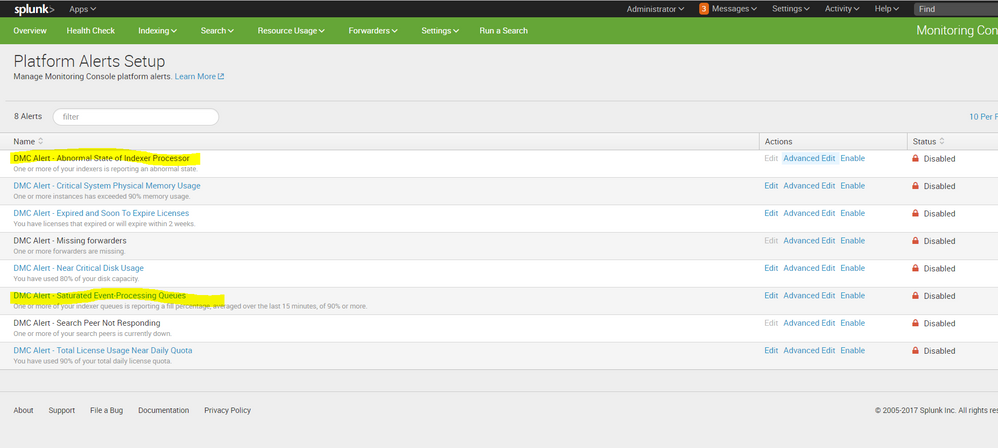
you can use the DMC (or MC), it has pre-built alerts on indexing queues and indexers performance, screenshot 1
also you can navigate on DMC to Resource Usage: Machine -> scroll down to see the I/O graph.
open that in search will show you the following:
 `dmc_set_index_introspection` sourcetype=splunk_resource_usage component=IOStats host=<yourHost>
              | eval mount_point = 'data.mount_point'
              | eval reads_ps = 'data.reads_ps'
              | eval writes_ps = 'data.writes_ps'
              | eval interval = 'data.interval'
              | eval op_count = (reads_ps + writes_ps) * interval
              | eval avg_service_ms = 'data.avg_service_ms'
              | eval avg_wait_ms = 'data.avg_total_ms'
              | eval cpu_pct = 'data.cpu_pct'
              | eval network_pct = 'data.network_pct' | `dmc_timechart_for_iostats` per_second(op_count) as iops, avg(data.cpu_pct) as avg_cpu_pct, avg(data.avg_service_ms) as avg_service_ms, avg(data.avg_total_ms) as avg_wait_ms, avg(data.network_pct) as avg_network_pct
                | eval iops = round(iops)
                | eval avg_cpu_pct = round(avg_cpu_pct)
                | eval avg_service_ms = round(avg_service_ms)
                | eval avg_wait_ms = round(avg_wait_ms)
                | eval avg_network_pct = round(avg_network_pct)
                | fields _time, iops avg_wait_ms
                | rename avg_wait_ms as "Wait Time"
which you can modify and use as a base to your alerts
hope it helps
screenshot 1:


Join the Splunk Community Slack to learn, troubleshoot, and make connections with fellow Splunk practitioners in real time!
Join Splunk User Groups to connect and learn in-person by region or remotely by topic or industry.
Meet the .conf26 AI Agent Buildathon Winners
Trusted Autonomy in the SOC: A Maturity Journey
Supercharging Windows Security Detection Performance: Introducing Hybrid Field ...
