- Splunk Answers
- :
- Splunk Administration
- :
- Getting Data In
- :
- Re: HEC: How to set _time on base of a specific JS...
- Subscribe to RSS Feed
- Mark Topic as New
- Mark Topic as Read
- Float this Topic for Current User
- Bookmark Topic
- Subscribe to Topic
- Mute Topic
- Printer Friendly Page
- Mark as New
- Bookmark Message
- Subscribe to Message
- Mute Message
- Subscribe to RSS Feed
- Permalink
- Report Inappropriate Content
Hi,
I have the following json which I put in through HEC:
{
    "message": {
        "metadata": {
            "id": "https://...",
            "uri": "https://...",
            "type": "com...."
        },
        "messageGuid": "AF8aCGJx-9ZI-JGyvFTGoSufbXlA",
        "correlationId": "AF8aCGI8ISFZGiG8eh9NAegmK2q5",
        "logStart": "2020-07-23T22:00:02.4",
        "logEnd": "2020-07-23T22:00:10.866",
        "integrationFlowName": "Sample_Flow",
        "status": "DONE",
        "alternateWebLink": "https://...",
        "logLevel": "INFO",
        "customStatus": "DONE",
        "transactionId": "afdfb636cbce4dd0b537b6623954a490"
    }
}
I log it with the splunk logging library (appender is com.splunk.logging.HttpEventCollectorLogbackAppender) with a defined sourcetype.
The _time attribute of the event in Splunk I need to set with the value of the json field "logStart".
For this purpose I have the following settings in the sourcetype:
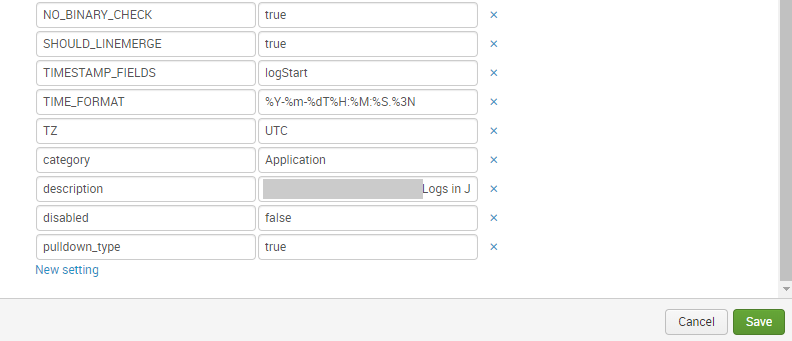
As result I get the following json in Splunk:
{
    "severity": "INFO",
    "logger": "SplunkLogger",
    "time": "1595593644.384",
    "thread": "http-nio-8080-exec-1",
    "message": {
        "metadata": {
            "id": "https://...",
            "uri": "https://...",
            "type": "com...."
        },
        "messageGuid": "AF8aCGJx-9ZI-JGyvFTGoSufbXlA",
        "correlationId": "AF8aCGI8ISFZGiG8eh9NAegmK2q5",
        "logStart": "2020-07-23T22:00:02.4",
        "logEnd": "2020-07-23T22:00:10.866",
        "integrationFlowName": "Sample_Flow",
        "status": "DONE",
        "alternateWebLink": "https://...",
        "logLevel": "INFO",
        "customStatus": "DONE",
        "transactionId": "afdfb636cbce4dd0b537b6623954a490"
    }
}
And the _time value has been setted on base of the epoch time, that was generated via the splunk appender (current log time).
I didn't find any possibility to influence the generation of the "time" field in the splunk logging library:
https://github.com/splunk/splunk-library-javalogging
How can I let Splunk set the _time value on base of the specific json field "logStart"?
Thanks a lot
Best regards
- Mark as New
- Bookmark Message
- Subscribe to Message
- Mute Message
- Subscribe to RSS Feed
- Permalink
- Report Inappropriate Content
Hello,
now I find the reason:
In another thread @hernanb postet, that the "event" end point of HEC is forwarding the data directly without parsing to the indexing (additionally HEC has a "raw" endpoint, that parses the data before). Here the link to the thread:
As I use the Splunk-Logging-Library (it is using by default the "event" end point), I needed to add a "type" element in the appender configuration (with the value 'raw'):
<Appender name="Splunk_HEC_Local"
		class="com.splunk.logging.HttpEventCollectorLogbackAppender">
		<url>https://localhost:8088</url>
		<token>aaaaaaaaa-bbbbbbbbb-cccccccc</token>
	<disableCertificateValidation>true</disableCertificateValidation>
		<batch_size_count>1</batch_size_count>
		<sourcetype>odata_mpl_message_json</sourcetype>
		<source>Splunk-Integration</source>
		<layout class="ch.qos.logback.classic.PatternLayout">
			<pattern>%msg</pattern>
		</layout>
		<type>raw</type>
	</Appender>
Then I changed the props.conf to the original expected solution:
[odata_mpl_message_json]
CHARSET = UTF-8
INDEXED_EXTRACTIONS = json
KV_MODE = none
SHOULD_LINEMERGE = false
disabled = false
pulldown_type = 1
TIME_FORMAT=%FT%T.%3N
TIMESTAMP_FIELDS=event.message.logStart
LINE_BREAKER = ([\r\n]+)
category = Custom
description = ODATA SCPI MPL JSON
When I send logs over the HEC now, the events have a little different structure with an "event" field:
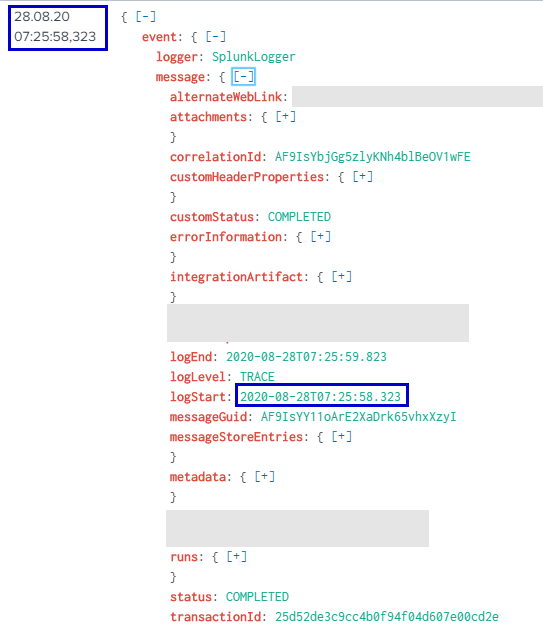 |
Then as you can see in the screenshot, the _time event attribute has been setted on base of the json field "event.message.logStart".
To find this solution it was necessary to look to the source code of the classes HttpEventCollectorSender.java and HttpEventCollectorLoggingHandler because this aspect is not documented.
Nevertheless thanks for your support.
- Mark as New
- Bookmark Message
- Subscribe to Message
- Mute Message
- Subscribe to RSS Feed
- Permalink
- Report Inappropriate Content
- Mark as New
- Bookmark Message
- Subscribe to Message
- Mute Message
- Subscribe to RSS Feed
- Permalink
- Report Inappropriate Content
- Mark as New
- Bookmark Message
- Subscribe to Message
- Mute Message
- Subscribe to RSS Feed
- Permalink
- Report Inappropriate Content
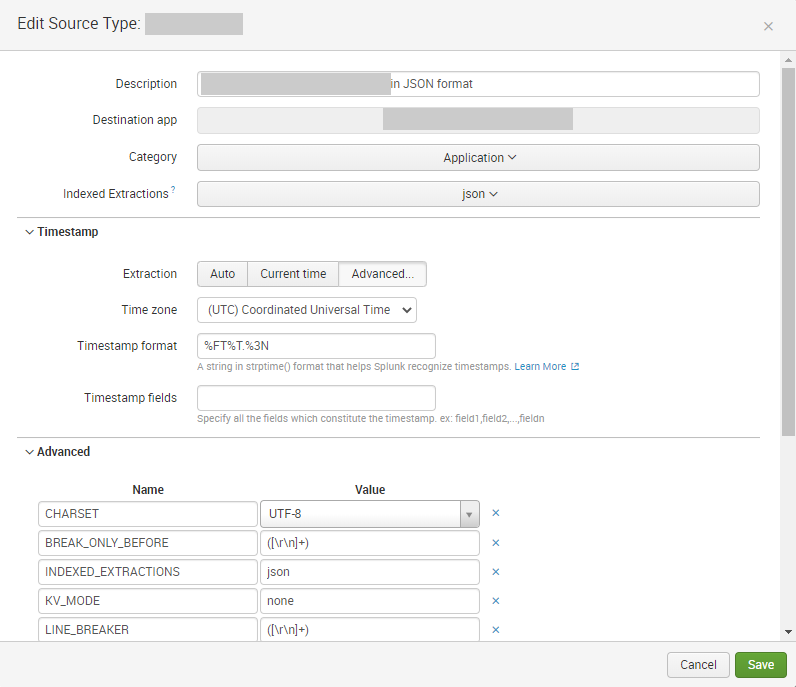
thanks for your replies,
I changed now the configuration as following
 |
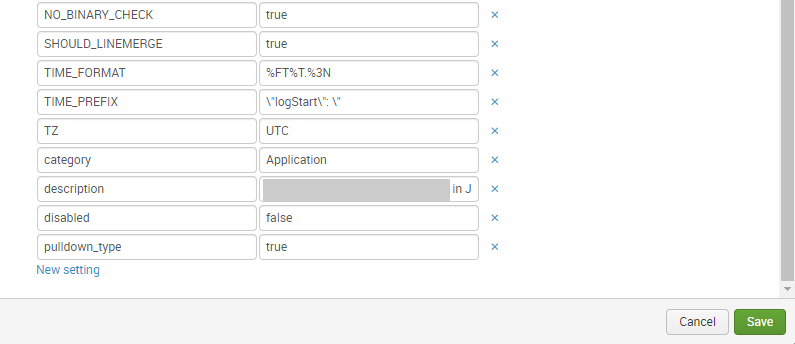 |
But the result is the same:
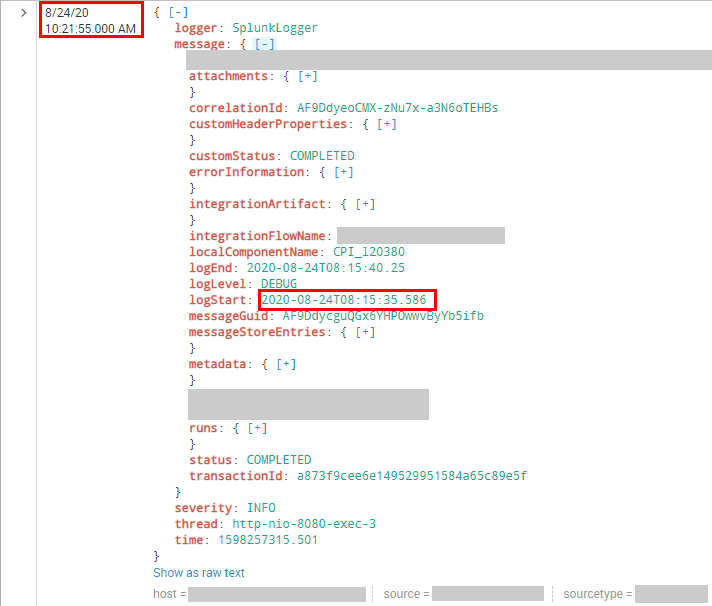 |
Any other comments/suggestions?
Thanks a lot.
- Mark as New
- Bookmark Message
- Subscribe to Message
- Mute Message
- Subscribe to RSS Feed
- Permalink
- Report Inappropriate Content
TIMESTAMP_FIELDS=message.logStart
not TIME_PREFIX and TIME_FORMAT
P.S. SHOULD_LINEMERGE = false is better.
- Mark as New
- Bookmark Message
- Subscribe to Message
- Mute Message
- Subscribe to RSS Feed
- Permalink
- Report Inappropriate Content
I tried w/o TIME_FORMAT and without TIME_PREFIX and changed the TIMESTAMP_FIELDS as you suggested.
I see no change.
In the configuration I realized, that the UI is not allowing me to change to SHOULD_LINEMERGE = false
The UI is changing it automatically to SHOULD_LINEMERGE = true
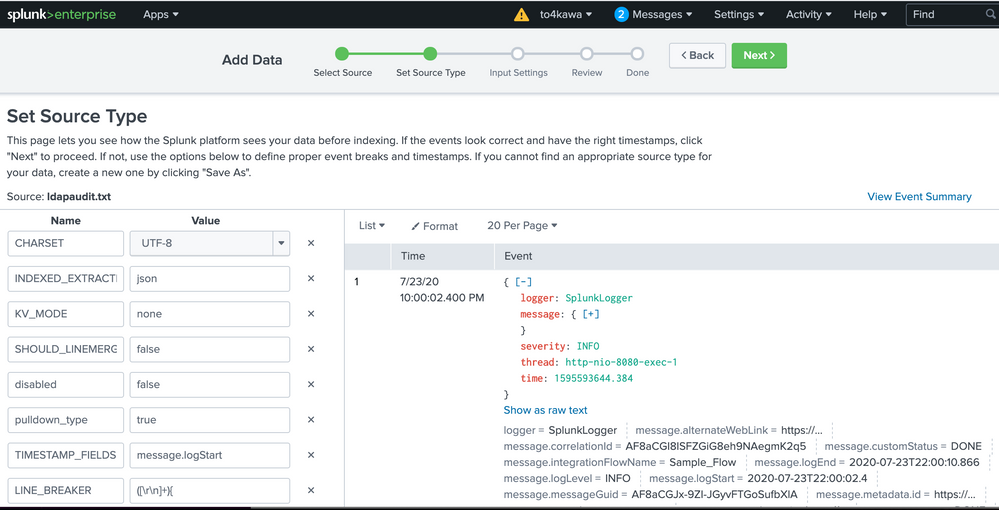
Here the latest configuration:
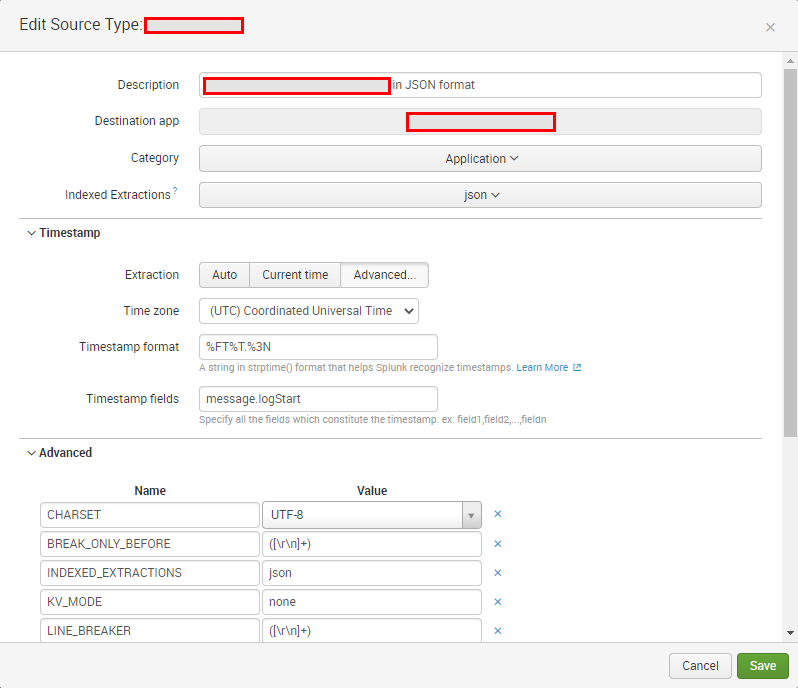 |
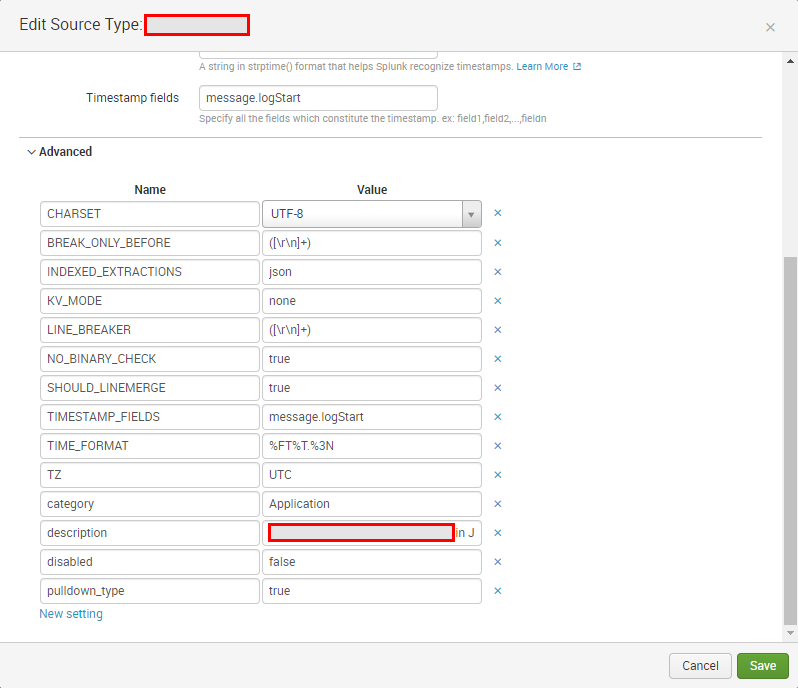 |
Which other points can effect, that Splunk is taking the generated time attribute?
Do you know any impacts due to KV_MODE and INDEXED_EXTRACTIONS?
- Mark as New
- Bookmark Message
- Subscribe to Message
- Mute Message
- Subscribe to RSS Feed
- Permalink
- Report Inappropriate Content
- Mark as New
- Bookmark Message
- Subscribe to Message
- Mute Message
- Subscribe to RSS Feed
- Permalink
- Report Inappropriate Content
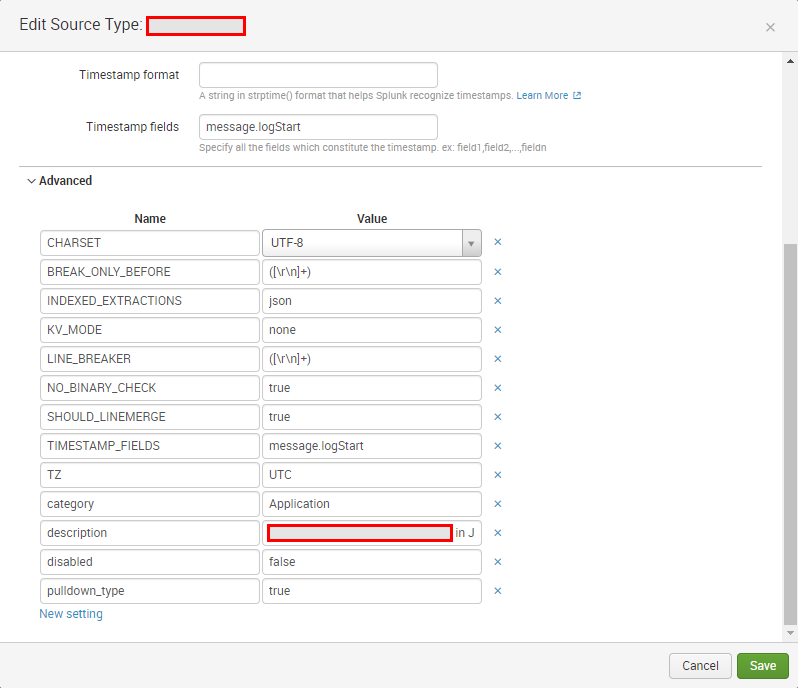
As I've written, I removed the TIME_FORMAT before, without any effect.
Here the configuration now:
 |
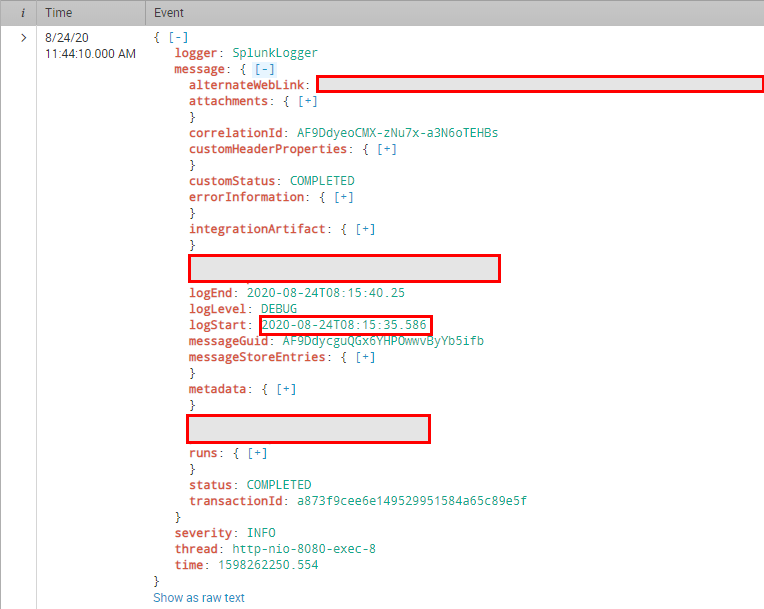
The result ist the same:
 |
- Mark as New
- Bookmark Message
- Subscribe to Message
- Mute Message
- Subscribe to RSS Feed
- Permalink
- Report Inappropriate Content
Here an additional information about my case:
I put the events through HEC (HTTP Event Collector) via the Splunk Logging Library.
Here the log configuration:
<Appender name="Splunk_HEC_Q"
		class="com.splunk.logging.HttpEventCollectorLogbackAppender">
		<url>https://xxxxxxxxxx.com:8088</url>
		<token>aaaaaaaaa-bbbb-dddd-aaaa-xxxxxxxxxxxxx</token>
		<disableCertificateValidation>true</disableCertificateValidation>
		<batch_size_count>1</batch_size_count>
		<sourcetype>xxxxxx:json</sourcetype>
		<source>xxxxxxx</source>
		<layout class="ch.qos.logback.classic.PatternLayout">
			<pattern>%msg</pattern>
		</layout>
	</Appender>
- Mark as New
- Bookmark Message
- Subscribe to Message
- Mute Message
- Subscribe to RSS Feed
- Permalink
- Report Inappropriate Content
your _time is time field value.
I don't know why you are using the time field as a value.
You say it's changed, but it hasn't changed at all.
- Mark as New
- Bookmark Message
- Subscribe to Message
- Mute Message
- Subscribe to RSS Feed
- Permalink
- Report Inappropriate Content
I guess you mean the time field in the below (marked blue):
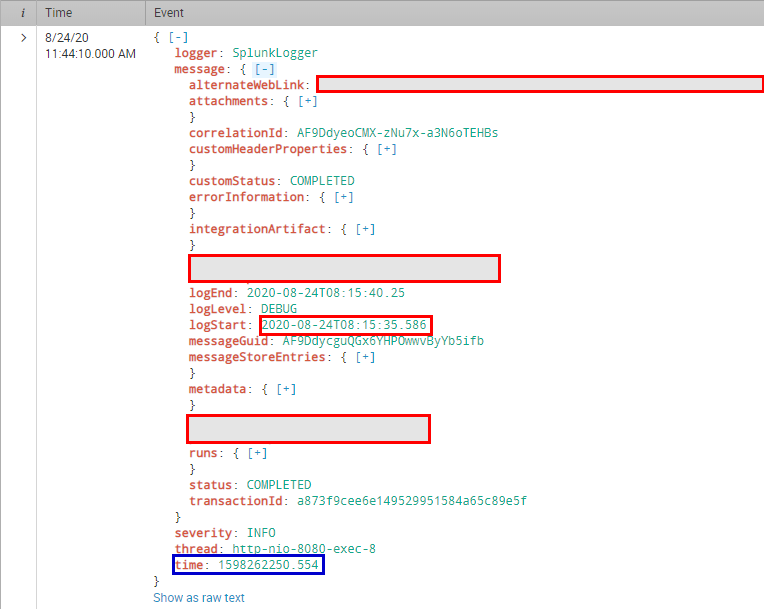 |
This field is generated via the Splunk logging library, as I explained in my first entry here.
I cannot influence the generation of this field (together with the other fields severity, thread and logger).
Would it help to convert the message.logStart value to epoch time, or would Splunk ever take the generated time field in the json root element?
- Mark as New
- Bookmark Message
- Subscribe to Message
- Mute Message
- Subscribe to RSS Feed
- Permalink
- Report Inappropriate Content
@yuemsek
The changes in props.conf have not been applied to the log at all. Did you reboot or something?
- Mark as New
- Bookmark Message
- Subscribe to Message
- Mute Message
- Subscribe to RSS Feed
- Permalink
- Report Inappropriate Content
Hello,
I installed now the trial version of Splunk Enterprise and tried several configurations out. In every modification I restarted Splunk. But in all cases the effect was the same: The indexer (I guess) is taking the value of the generated field "time" to set the event attribute "_time".
Here the props.conf configurations I tried out:
[odata_mpl_message_json]
CHARSET = UTF-8
INDEXED_EXTRACTIONS = json
KV_MODE = none
LINE_BREAKER = ([\r\n]+)
NO_BINARY_CHECK = true
SHOULD_LINEMERGE = false
TIMESTAMP_FIELDS = message.logStart
category = Custom
description = ODATA SCPI MPL JSON
pulldown_type = 1
disabled = false
[odata_mpl_message_json]
CHARSET = UTF-8
INDEXED_EXTRACTIONS = json
KV_MODE = none
LINE_BREAKER = ([\r\n]+)
NO_BINARY_CHECK = true
SHOULD_LINEMERGE = false
TIME_PREFIX=\"logStart\":\"
category = Custom
description = ODATA SCPI MPL JSON
pulldown_type = 1
disabled = false[odata_mpl_message_json]
CHARSET = UTF-8
INDEXED_EXTRACTIONS = json
KV_MODE = none
LINE_BREAKER = ([\r\n]+)
NO_BINARY_CHECK = true
SHOULD_LINEMERGE = false
TIME_PREFIX="logStart":"
category = Custom
description = ODATA SCPI MPL JSON
pulldown_type = 1
disabled = false[odata_mpl_message_json]
CHARSET = UTF-8
INDEXED_EXTRACTIONS = json
KV_MODE = none
LINE_BREAKER = ([\r\n]+)
NO_BINARY_CHECK = true
SHOULD_LINEMERGE = false
TIME_PREFIX="logStart":"
TIME_FORMAT=%FT%T.%3N
category = Custom
description = ODATA SCPI MPL JSON
pulldown_type = 1
disabled = false[odata_mpl_message_json]
CHARSET = UTF-8
INDEXED_EXTRACTIONS = json
KV_MODE = none
SHOULD_LINEMERGE = false
disabled = false
pulldown_type = 1
TIMESTAMP_FIELDS=message.logStart
LINE_BREAKER = ([\r\n]+){
category = Custom
description = ODATA SCPI MPL JSON[odata_mpl_message_json]
CHARSET = UTF-8
INDEXED_EXTRACTIONS = json
KV_MODE = none
SHOULD_LINEMERGE = false
disabled = false
pulldown_type = 1
TIME_FORMAT=%FT%T.%3N
TIMESTAMP_FIELDS=message.logStart
LINE_BREAKER = ([\r\n]+){
category = Custom
description = ODATA SCPI MPL JSONWhere can I look to better understand the reasons of this behavior (logs etc.)?
Do you have any other suggestions?
Thanks a lot.
- Mark as New
- Bookmark Message
- Subscribe to Message
- Mute Message
- Subscribe to RSS Feed
- Permalink
- Report Inappropriate Content
All regex is wrong and LINE_BREAKER breaks json format.
- Mark as New
- Bookmark Message
- Subscribe to Message
- Mute Message
- Subscribe to RSS Feed
- Permalink
- Report Inappropriate Content
Hi,
I corrected the configuration in the following way:
[odata_mpl_message_json]
CHARSET = UTF-8
INDEXED_EXTRACTIONS = json
KV_MODE = none
SHOULD_LINEMERGE = false
disabled = false
pulldown_type = 1
TIME_FORMAT = %FT%T.%3N
TIMESTAMP_FIELDS = message.logStart
category = Custom
description = ODATA SCPI MPL JSON
NO_BINARY_CHECK = true
But result is the same.
And by the way: If I open the configuration above in the UI, the UI is putting the LINE_BREACKER option to the configuration:
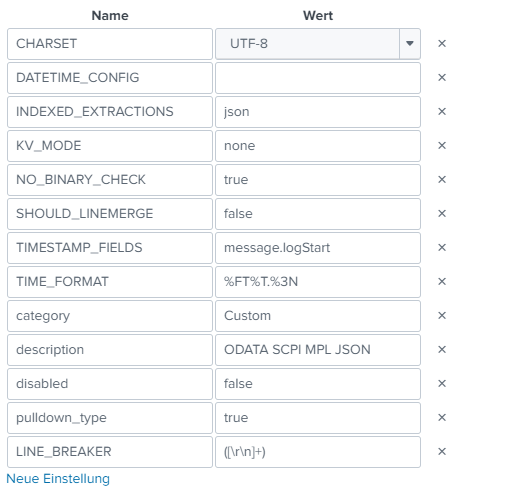 |
- Mark as New
- Bookmark Message
- Subscribe to Message
- Mute Message
- Subscribe to RSS Feed
- Permalink
- Report Inappropriate Content
Hello,
now I find the reason:
In another thread @hernanb postet, that the "event" end point of HEC is forwarding the data directly without parsing to the indexing (additionally HEC has a "raw" endpoint, that parses the data before). Here the link to the thread:
As I use the Splunk-Logging-Library (it is using by default the "event" end point), I needed to add a "type" element in the appender configuration (with the value 'raw'):
<Appender name="Splunk_HEC_Local"
		class="com.splunk.logging.HttpEventCollectorLogbackAppender">
		<url>https://localhost:8088</url>
		<token>aaaaaaaaa-bbbbbbbbb-cccccccc</token>
	<disableCertificateValidation>true</disableCertificateValidation>
		<batch_size_count>1</batch_size_count>
		<sourcetype>odata_mpl_message_json</sourcetype>
		<source>Splunk-Integration</source>
		<layout class="ch.qos.logback.classic.PatternLayout">
			<pattern>%msg</pattern>
		</layout>
		<type>raw</type>
	</Appender>
Then I changed the props.conf to the original expected solution:
[odata_mpl_message_json]
CHARSET = UTF-8
INDEXED_EXTRACTIONS = json
KV_MODE = none
SHOULD_LINEMERGE = false
disabled = false
pulldown_type = 1
TIME_FORMAT=%FT%T.%3N
TIMESTAMP_FIELDS=event.message.logStart
LINE_BREAKER = ([\r\n]+)
category = Custom
description = ODATA SCPI MPL JSON
When I send logs over the HEC now, the events have a little different structure with an "event" field:
 |
Then as you can see in the screenshot, the _time event attribute has been setted on base of the json field "event.message.logStart".
To find this solution it was necessary to look to the source code of the classes HttpEventCollectorSender.java and HttpEventCollectorLoggingHandler because this aspect is not documented.
Nevertheless thanks for your support.
- Mark as New
- Bookmark Message
- Subscribe to Message
- Mute Message
- Subscribe to RSS Feed
- Permalink
- Report Inappropriate Content
Hello to4kawa,
do you mean we need to reboot the environment after we changed the configuration?
I've only some rights about sourcetypes etc. in web ui. For a reboot I need to ask the administrators.
Thanks and best regards.
