- Splunk Answers
- :
- Using Splunk
- :
- Dashboards & Visualizations
- :
- returning zero value for non existent event in tim...
- Subscribe to RSS Feed
- Mark Topic as New
- Mark Topic as Read
- Float this Topic for Current User
- Bookmark Topic
- Subscribe to Topic
- Mute Topic
- Printer Friendly Page
- Mark as New
- Bookmark Message
- Subscribe to Message
- Mute Message
- Subscribe to RSS Feed
- Permalink
- Report Inappropriate Content
Hi
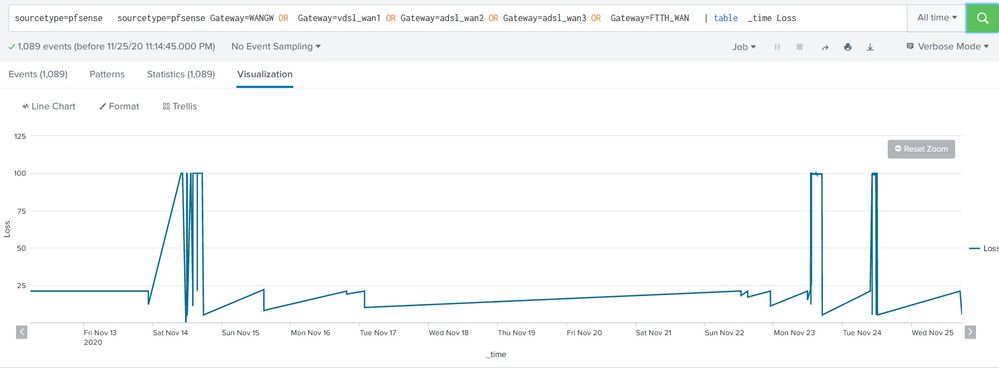
i want to make a chart that shows real time packet loss percentage of gateways but there are two problem
1.the firewall sends logs only when packet loss occurring therefor in line-chart there is no correct value for zero packet loss since line match two non zero points
2. i want to show all five gateway in single chart with different colors
here is what i search and get...
TNX
- Mark as New
- Bookmark Message
- Subscribe to Message
- Mute Message
- Subscribe to RSS Feed
- Permalink
- Report Inappropriate Content
Hi @Depressedadmin ,
For both of your questions, you can use the below answer.
<your base query>
|timechart span=1s count(Loss) as Loss by GATEWAY
This will show all 5 gateway in different colors and it will show the count 0 if it is pocket loss.
PS: Do not select All time until unless it is required and with timechart you can retrieve only 10000 rows at a time, so choose the time wisely else increase the span to 1m or 1h or 1d.
- Mark as New
- Bookmark Message
- Subscribe to Message
- Mute Message
- Subscribe to RSS Feed
- Permalink
- Report Inappropriate Content
tnx alot for response, i wanted the value of Loss percentage itself no count or avg or ...
i used list and values instead of count and result is correct but there is points on chart instead of lines...
- Mark as New
- Bookmark Message
- Subscribe to Message
- Mute Message
- Subscribe to RSS Feed
- Permalink
- Report Inappropriate Content
Hi @Depressedadmin ,
to make it looks like a line, please go to Format-> select the second one in the Null values. This will help to plot the line when it is null values.


