- Splunk Answers
- :
- Using Splunk
- :
- Dashboards & Visualizations
- :
- Splunk dashboard (I wanted to update all 3 alert(c...
- Subscribe to RSS Feed
- Mark Topic as New
- Mark Topic as Read
- Float this Topic for Current User
- Bookmark Topic
- Subscribe to Topic
- Mute Topic
- Printer Friendly Page
- Mark as New
- Bookmark Message
- Subscribe to Message
- Mute Message
- Subscribe to RSS Feed
- Permalink
- Report Inappropriate Content
- Mark as New
- Bookmark Message
- Subscribe to Message
- Mute Message
- Subscribe to RSS Feed
- Permalink
- Report Inappropriate Content
Use
|chart count over dv_assignment_group by priorityrather than stats and stack the bar chart
- Mark as New
- Bookmark Message
- Subscribe to Message
- Mute Message
- Subscribe to RSS Feed
- Permalink
- Report Inappropriate Content
You want a stacked bar chart - go to Vizualisation/Format/Stacked Mode and select stacked
- Mark as New
- Bookmark Message
- Subscribe to Message
- Mute Message
- Subscribe to RSS Feed
- Permalink
- Report Inappropriate Content
I used query.
index=generic_servicenow dv_sys_created_by=system sourcetype="snow:incident" dv_caller_id="Event Management"
|stats count by dv_assignment_group priority
|sort dv_assignment_group
but here for priority and count is showing different bar.
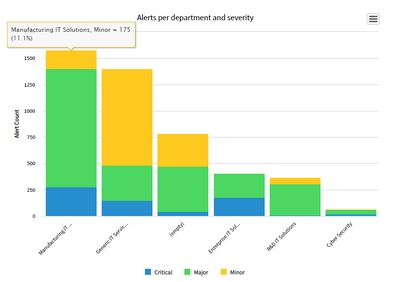
I want same bar for priority P2, P3 and P4 with different color in the dashboard similar to the screenshot which I have attached.
- Mark as New
- Bookmark Message
- Subscribe to Message
- Mute Message
- Subscribe to RSS Feed
- Permalink
- Report Inappropriate Content
Use
|chart count over dv_assignment_group by priorityrather than stats and stack the bar chart
- Mark as New
- Bookmark Message
- Subscribe to Message
- Mute Message
- Subscribe to RSS Feed
- Permalink
- Report Inappropriate Content
Hi,
Can you please elaborate your question little more,
Do you need the solution like in the image u shown ??
- Mark as New
- Bookmark Message
- Subscribe to Message
- Mute Message
- Subscribe to RSS Feed
- Permalink
- Report Inappropriate Content
I used query.
index=generic_servicenow dv_sys_created_by=system sourcetype="snow:incident" dv_caller_id="Event Management"
|stats count by dv_assignment_group priority
|sort dv_assignment_group
but here for priority and count is showing different bar.
I want same bar for priority P2, P3 and P4 with different color in the dashboard similar to the screenshot which I have attached.
- Mark as New
- Bookmark Message
- Subscribe to Message
- Mute Message
- Subscribe to RSS Feed
- Permalink
- Report Inappropriate Content
yes

