- Splunk Answers
- :
- Using Splunk
- :
- Dashboards & Visualizations
- :
- Single value Trellis and appendpipe problem
- Subscribe to RSS Feed
- Mark Topic as New
- Mark Topic as Read
- Float this Topic for Current User
- Bookmark Topic
- Subscribe to Topic
- Mute Topic
- Printer Friendly Page
- Mark as New
- Bookmark Message
- Subscribe to Message
- Mute Message
- Subscribe to RSS Feed
- Permalink
- Report Inappropriate Content
Single value Trellis and appendpipe problem
I'm trying to create a panel with a Single Value Trellis visualization with trend that shows "No data" if the search result was 0. When there is a result one could drill down to the method.
This is the search query I was going to use:
index=main source="/home/splunk/tmp/web00*"  sourcetype=access_combined
| timechart  count by method
| appendpipe [stats count | eval msg="No data"  | where count==0 ]
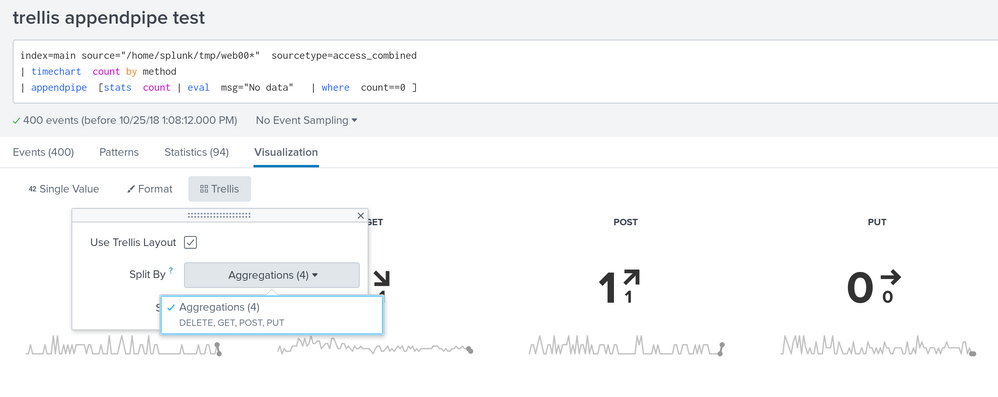
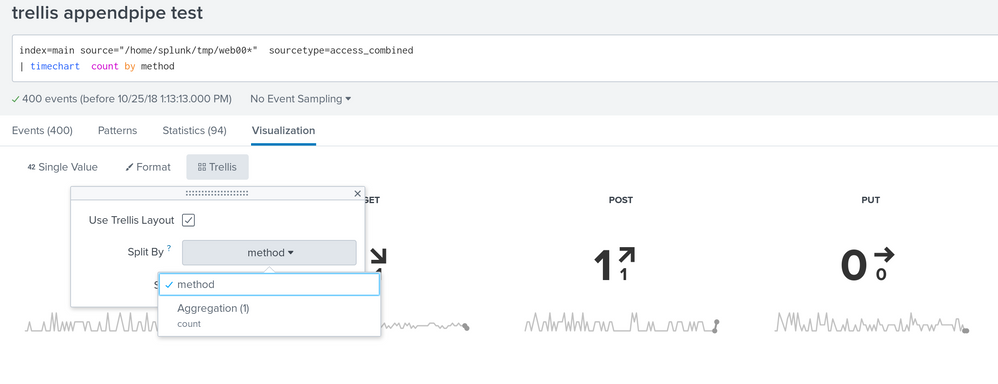
It didn't work out the way I expected. I think appendpipe somewhat messes up the statistical data. When configuring Trellis, I can only select aggregation and not the field 'method' (splitBy). Because I would like to drilldown I need the Trellis tokens that are not available when using aggregation.
To confirm Trellis works I removed the appendpipe and the drilldown works as expected (after some adjustment of the trellis config).
-> Why would Trellis break when using appendpipe in this way?
-> Is this a feature or a bug?
I found another user experiencing the same problem: "I have tried the appendpipe command, but this seems to stuff up the trellis display." ( @kozanic_FF / https://answers.splunk.com/answers/685851/how-do-you-present-an-all-green-dashboard-when-no.html )
I took some screenshots from a test setup (Splunk 7.2.0 running in docker and filled with some generated apache logging).
- Mark as New
- Bookmark Message
- Subscribe to Message
- Mute Message
- Subscribe to RSS Feed
- Permalink
- Report Inappropriate Content
Try this instead...
| appendpipe [stats count | where count==0 | eval method="No data" | table method ]
Explanation - Think about what the records look like that Trellis is supposed to be receiving. There are individual fields called "POST" and "PUT" and "GET", and those names came from the values of a split-by field called method. Since they are coming direct from timechart, there is some additional information coming along that tells Trellis what that split-by field name was that was timecharted (in this case, method ).
When there is no data at all coming from the timechart, then the appendpipe will be the only place that any data exists. So, you should align the name of the field that you are putting the "no data" flag in ... which is the ONLY field you pass out of the appendpipe to the single-value viz ... you align that name with the name of the split-by field, and the action of the single-value viz will therefore be more sensible.
Here's a run-anywhere example for folks to play with.
First, set your timeframe to the last 30 seconds and then run this,
index=_internal  eventtype=splunkd-log
| timechart count by component
| appendpipe [|stats count | where count==0 | eval component="No Data" | table component]
Then, set the viz to single-value and Trellis, and verify that you get a number of sv panels with sparklines, one for each component.
After that, change the first line of the search to eventtype=splunkd-log-nonesuch and see that the single-value viz works as expected, showing only a message that says "no data".
- Mark as New
- Bookmark Message
- Subscribe to Message
- Mute Message
- Subscribe to RSS Feed
- Permalink
- Report Inappropriate Content
@DalJeanis Thank you for you comment, but unfortunately your example has the same problem and isn't a solution to my problem. My objective is to create a dashboard with this Single Trellis visualization where I can drilldown on the method field (or component field in your example). Because the splitBy isn't available for the field 'method' (or 'component' in your example) I cannot use Trellis tokens needed in the drilldown. When the appendpipe is left out, the splitBy is done right and the Trellis tokens are available. The splitBy is done right when it is possible to choose the field 'method' at splitBy in the Trellis configuration. If only the aggregation is available, the Trellis tokens are not there to use.
- Mark as New
- Bookmark Message
- Subscribe to Message
- Mute Message
- Subscribe to RSS Feed
- Permalink
- Report Inappropriate Content
@vxsplunk Did you ever find a solution for this issue? I am having the same issue currently and am unable to fix it.
- Mark as New
- Bookmark Message
- Subscribe to Message
- Mute Message
- Subscribe to RSS Feed
- Permalink
- Report Inappropriate Content
@niketnilay Since you gave some useful feedback last time, I invite you to help me with this one too. 😉


