- Splunk Answers
- :
- Using Splunk
- :
- Dashboards & Visualizations
- :
- Single Value Panel on absolute metric resets to 0
- Subscribe to RSS Feed
- Mark Topic as New
- Mark Topic as Read
- Float this Topic for Current User
- Bookmark Topic
- Subscribe to Topic
- Mute Topic
- Printer Friendly Page
- Mark as New
- Bookmark Message
- Subscribe to Message
- Mute Message
- Subscribe to RSS Feed
- Permalink
- Report Inappropriate Content
Apologies in advance if I'm mixing some terminology. I'm relatively new to Splunk.
I'm building a Splunk app to monitor our product, Mattermost. We expose Prometheus style metrics and I'm using this Prometheus data input type by @luke.monahan@rivium.com.au to get the metrics in (thanks Luke!).
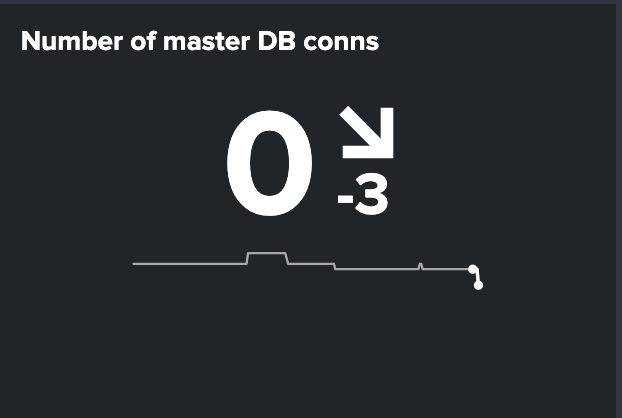
We have a metric mattermost_db_master_connections_total that is displayed in a Single Value chart at the top of a dashboard, as well as in amongst some time series charts below. The time series chart seems to match with what I see in our equivalent Grafana dashboard, but the Single Value stat seems to bounce between 0 and the value I would expect, depending on the timing of when I refresh the dashboard.
Is there something I should be doing in my query to smooth out those drops to 0 on the single value panel? What is happening here? Missing values I don't see on the time series?
Single Value Query:
| mstats max(_value) prestats=true WHERE metric_name="mattermost_db_master_connections_total" AND sourcetype=prometheus:metric  span=15s

| timechart max(_value) span=15s
Time Series Query:
| mstats max(_value) prestats=true WHERE metric_name="mattermost_db_master_connections_total" AND sourcetype=prometheus:metric  span=15s BY host

| timechart max(_value) span=15s agg=max useother=false BY host

| addtotals
Screenshots:
Single Value (after refreshing... and seemingly majority of the time it looks like this... every few refreshes I'll get 3 as expected):
Time Series Plot:
- Mark as New
- Bookmark Message
- Subscribe to Message
- Mute Message
- Subscribe to RSS Feed
- Permalink
- Report Inappropriate Content
smooth out those drops to 0
If there is no data at 15 second intervals, 0 is displayed.
What should it do?
Why don't you try to expand time span?
- Mark as New
- Bookmark Message
- Subscribe to Message
- Mute Message
- Subscribe to RSS Feed
- Permalink
- Report Inappropriate Content
smooth out those drops to 0
If there is no data at 15 second intervals, 0 is displayed.
What should it do?
Why don't you try to expand time span?
- Mark as New
- Bookmark Message
- Subscribe to Message
- Mute Message
- Subscribe to RSS Feed
- Permalink
- Report Inappropriate Content
Thanks for weighing in. I increased the span and this appears to have resolved the drops to 0.
- Mark as New
- Bookmark Message
- Subscribe to Message
- Mute Message
- Subscribe to RSS Feed
- Permalink
- Report Inappropriate Content
@sadohert - if your problem is solved, please accept the solution. Thanks!
- Mark as New
- Bookmark Message
- Subscribe to Message
- Mute Message
- Subscribe to RSS Feed
- Permalink
- Report Inappropriate Content
Thanks. I was looking for a way to do this earlier today, but didn't see the button. Done


