Turn on suggestions
Auto-suggest helps you quickly narrow down your search results by suggesting possible matches as you type.
Showing results for
Dashboards & Visualizations
Turn on suggestions
Auto-suggest helps you quickly narrow down your search results by suggesting possible matches as you type.
Showing results for
- Splunk Answers
- :
- Using Splunk
- :
- Dashboards & Visualizations
- :
- Single Value: Current Server RAM Usage
Options
- Subscribe to RSS Feed
- Mark Topic as New
- Mark Topic as Read
- Float this Topic for Current User
- Bookmark Topic
- Subscribe to Topic
- Mute Topic
- Printer Friendly Page
- Mark as New
- Bookmark Message
- Subscribe to Message
- Mute Message
- Subscribe to RSS Feed
- Permalink
- Report Inappropriate Content
mxanareckless
Path Finder
02-10-2021
03:11 PM
I need a Single Value widget for a dashboard which displays current RAM usage in real-time.
This is what I have so far in SPL:
index=index host=host sourcetype=vmstat memUsedMB=*
| stats count
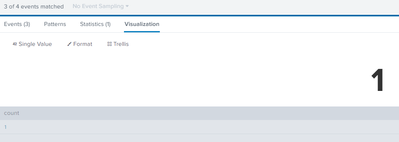
And this is all I'm getting:
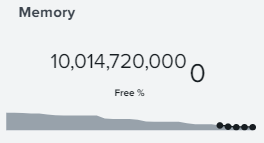
How can I get something more like this? :
1 Solution
- Mark as New
- Bookmark Message
- Subscribe to Message
- Mute Message
- Subscribe to RSS Feed
- Permalink
- Report Inappropriate Content
manjunathmeti
Champion
02-11-2021
01:51 AM
hi @mxanareckless,
Check if this works for you.
<dashboard>
  <label>Memory Usage</label>
  <row>
    <panel>
      <single>
        <title>Memory</title>
        <search>
          <query>index=index host=host sourcetype=vmstat memUsedMB=*
| stats latest(memUsedMB) as memUsedMB
| eval totalMem=10000 , freeMemPerc=(100*(totalMem-memUsedMB))/totalMem</query>
          <earliest>rt-1m</earliest>
          <latest>rt</latest>
          <progress>
            <set token="perc">$result.freeMemPerc$</set>
          </progress>
        </search>
        <option name="refresh.display">progressbar</option>
        <option name="showSparkline">0</option>
        <option name="showTrendIndicator">0</option>
        <option name="underLabel">Free $perc$ %.</option>
      </single>
    </panel>
  </row>
</dashboard>
If this reply helps you, an upvote/like would be appreciated.
- Mark as New
- Bookmark Message
- Subscribe to Message
- Mute Message
- Subscribe to RSS Feed
- Permalink
- Report Inappropriate Content
renjith_nair
Legend
02-10-2021
06:07 PM
Probably you should use
index=index host=host sourcetype=vmstat memUsedMB=*
| timechart max(memUsedMB) as memUsedMB
Happy Splunking!
Get Updates on the Splunk Community!
Announcing Scheduled Export GA for Dashboard Studio
We're excited to announce the general availability of Scheduled Export for Dashboard Studio. Starting in ...
Extending Observability Content to Splunk Cloud
Watch Now!
In this Extending Observability Content to Splunk Cloud Tech Talk, you'll see how to leverage ...
More Control Over Your Monitoring Costs with Archived Metrics GA in US-AWS!
What if there was a way you could keep all the metrics data you need while saving on storage costs?This is now ...


