- Splunk Answers
- :
- Using Splunk
- :
- Dashboards & Visualizations
- :
- Post Process searches to populate a table and a ro...
- Subscribe to RSS Feed
- Mark Topic as New
- Mark Topic as Read
- Float this Topic for Current User
- Bookmark Topic
- Subscribe to Topic
- Mute Topic
- Printer Friendly Page
- Mark as New
- Bookmark Message
- Subscribe to Message
- Mute Message
- Subscribe to RSS Feed
- Permalink
- Report Inappropriate Content
Post Process searches to populate a table and a row click to populate a chart
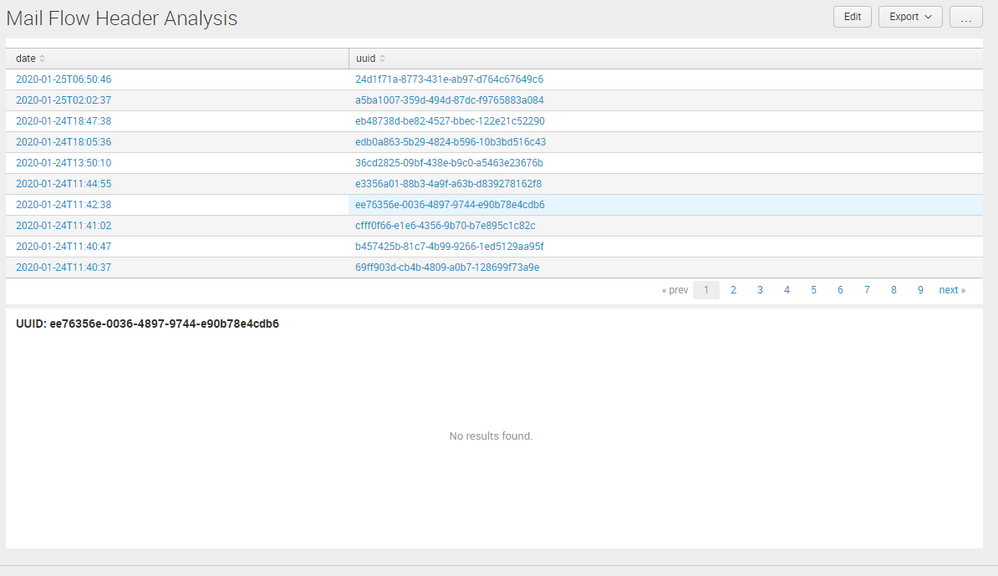
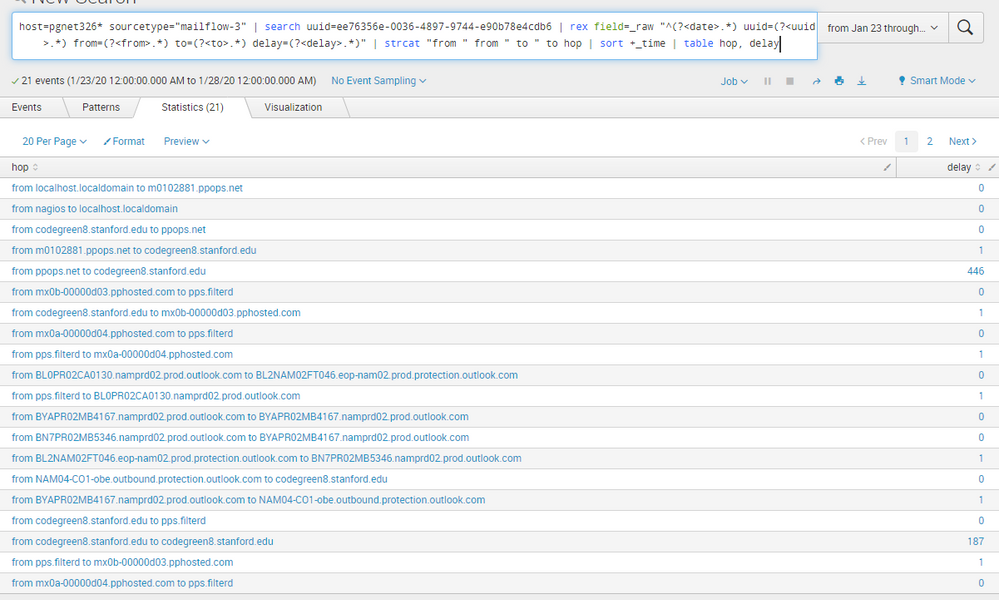
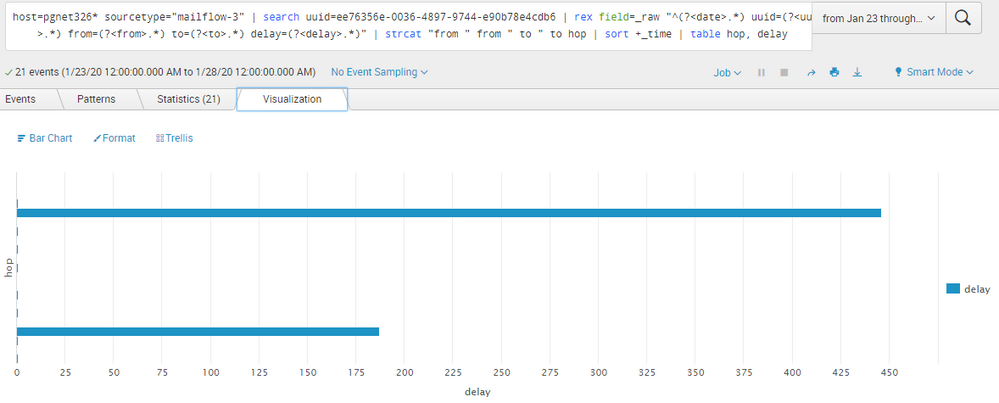
So I've been able to successfully configure a dashboard to utilize post process searching to populate a table of email headers. Once the user clicks on a specific row in the table, a UUID field is then passed onto a bar chart in the lower half of the dashboard. It appears that both post process searches are working, however the bar chart at the bottom ends up showing "No results found". However, when I click on the "Open in Search" for that bar chart, the correct Search query shows up including contextual UUID and there's data in the Search results. On top of that, if I click on the Visualizations tab, I see the bar chart that I'm looking for. Is there some sort of refresh of the bar chart that I'm missing on the table click? Is there some other reason why that bar chart won't populate?
<dashboard>
<label>Mail Flow Header Analysis</label>
<!-- Global Search for Mail Flow Header -->
<search id="allHeaders">
<query>host=pgnet326* sourcetype="mailflow-3"</query>
<earliest>1579766400</earliest>
<latest>1580198400</latest>
</search>
<row>
<panel>
<table>
<search base="allHeaders">
<query>search "from=nagios" | rex field=_raw "^(?<date>.*) uuid=(?<uuid>.*) from=" | table date,uuid</query>
</search>
<option name="count">10</option>
<option name="dataOverlayMode">none</option>
<option name="drilldown">cell</option>
<option name="percentagesRow">false</option>
<option name="rowNumbers">false</option>
<option name="totalsRow">false</option>
<option name="wrap">true</option>
<drilldown>
<set token="uuid_selected">$row.uuid$</set>
</drilldown>
</table>
</panel>
</row>
<row>
<panel>
<chart depends="$uuid_selected$">
<title>
UUID: $uuid_selected$
</title>
<search base="allHeaders">
<query>search uuid=$uuid_selected$ | rex field=_raw "^(?<date>.*) uuid=(?<uuid>.*) from=(?<from>.*) to=(?<to>.*) delay=(?<delay>.*)" | strcat "from " from " to " to hop | sort +_time | table hop, delay</query>
</search>
<option name="charting.chart">bar</option>
<option name="charting.drilldown">none</option>
</chart>
</panel>
</row>
</dashboard>


- Mark as New
- Bookmark Message
- Subscribe to Message
- Mute Message
- Subscribe to RSS Feed
- Permalink
- Report Inappropriate Content
try:
<query>search uuid=$uuid_selected|s$ ...- Mark as New
- Bookmark Message
- Subscribe to Message
- Mute Message
- Subscribe to RSS Feed
- Permalink
- Report Inappropriate Content
I tried: search uuid=$uuid_selected|s$
but there was no change.
- Mark as New
- Bookmark Message
- Subscribe to Message
- Mute Message
- Subscribe to RSS Feed
- Permalink
- Report Inappropriate Content
I figured out what the problem was. I needed to add " around uuid=$uuid_selected$". Without the quotes, it was looking for a field in the main search with uuid=<the selected UUID>, while this technically "should" work, the definition of that field doesn't happen until further down in the rex part of the query. By putting quotes around everything, I force the query to search within the main search for that specific string thereby filtering it down to the subset of data that I wanted. What really confused me is that clicking the Open in Search actually worked. In any case, it was a subtle difference, but apparently an important one for this dashboard.
<row>
<panel>
<chart depends="$uuid_selected$">
<title>
UUID: $uuid_selected$
</title>
<search base="allHeaders">
<query>search "uuid=$uuid_selected$" | rex field=_raw "^(?<date>.*) uuid=(?<uuid>.*) from=(?<from>.*) to=(?<to>.*) delay=(?<delay>.*)" | strcat "from " from " to " to hop | sort +_time | table hop, delay</query>
</search>
<option name="charting.chart">bar</option>
<option name="charting.drilldown">none</option>
</chart>
</panel>
</row>
