- Splunk Answers
- :
- Using Splunk
- :
- Dashboards & Visualizations
- :
- Monitoring Circuit Breaker Status?
- Subscribe to RSS Feed
- Mark Topic as New
- Mark Topic as Read
- Float this Topic for Current User
- Bookmark Topic
- Subscribe to Topic
- Mute Topic
- Printer Friendly Page
- Mark as New
- Bookmark Message
- Subscribe to Message
- Mute Message
- Subscribe to RSS Feed
- Permalink
- Report Inappropriate Content
Monitoring Circuit Breaker Status?
Hello!
I'm implementing a custom circuit breaker in my application spring gateway application, which returns the following event/log:
| 1/20/23 1:20:28.487 PM |
[app=teste-gateway, traceId=traceid, spanId=spanId, INFO CircuitBreakerCustomConfig : Circuit breaker circuitBreakerName=/test-circuit-breaker-gateway-route onStateTransition=State transition from CLOSED to OPEN fromState=CLOSED toState=OPEN stateName=CLOSED_TO_OPEN
|
There are about 120 hosts of this application.
If a request to a route starts receiving many errors it will open the circuit, and it will receive the above event, and eventually until the route stabilizes it will change to HALF-OPEN and CLOSED. Each route is represented by the circuitBreakerName field.
So, for example, in an instance/host, the route: /test-circuit-breaker-gateway-route will not have the above event/log until it opens the circuit due to many errors. Then it will receive the log just like the above with stateName=CLOSED_TO_OPEN. Eventually, it will change to stateName=OPEN_TO_HALF-OPEN, and then it can go to stateName=HALF-OPEN_TO_OPEN (if the errors continue) or stateName=HALF-OPEN_TO_CLOSED (if errors stop).
And according with how the requests are being balanced between hosts, I can have hosts where the circuit is currently HALF_OPEN, whereas at the same moment, others hosts have the circuit OPEN for the same route.
I would like to keep track of the routes with an OPEN circuit as it last status (most recent).
It could be something like a Line Chart, that Y-axis is the number of hosts with currently OPEN circuit, and X-axis is time.
So, I imagine that I'll have to check the last status of the above log for every host and search for OPEN. But I'm not really sure how to do this.
Is it possible? How can I do this?
Thank you for any help in advance. And sorry if I wrote anything wrong, english is not my main language.
- Mark as New
- Bookmark Message
- Subscribe to Message
- Mute Message
- Subscribe to RSS Feed
- Permalink
- Report Inappropriate Content
Hi @Stephcg,
Can you please try below?
index=gateway source=http:source-test sourcetype=sourcetype_teste-gateway toState=OPEN
| timechart dc(host) as count by circuitBreakerName- Mark as New
- Bookmark Message
- Subscribe to Message
- Mute Message
- Subscribe to RSS Feed
- Permalink
- Report Inappropriate Content
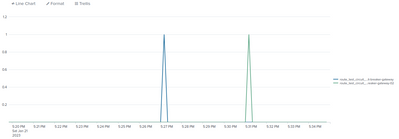
It almost works, but as the log of the changing of the circuit breaker only comes once, the second it OPENS it is registered, but it soon drops, even though the circuit breaker stills is OPEN and still didn't receive the log of HALF-OPEN.
But thank you for trying to help, I'll try a little more, or maybe, I'll just show on a table the one's who are currently open. But if I find anything, I'll report here.

