- Splunk Answers
- :
- Using Splunk
- :
- Dashboards & Visualizations
- :
- How to show more selected fields on dashboard even...
- Subscribe to RSS Feed
- Mark Topic as New
- Mark Topic as Read
- Float this Topic for Current User
- Bookmark Topic
- Subscribe to Topic
- Mute Topic
- Printer Friendly Page
- Mark as New
- Bookmark Message
- Subscribe to Message
- Mute Message
- Subscribe to RSS Feed
- Permalink
- Report Inappropriate Content
Hi There,
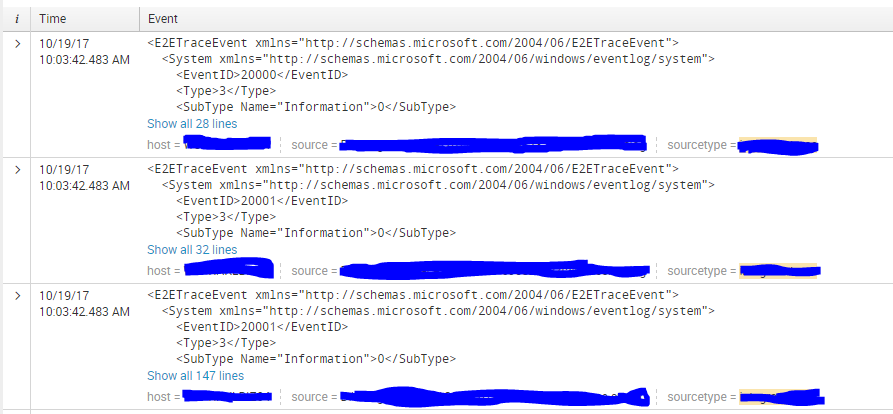
I have a dashboard I've created to explore XML trace transactions, it works fine, but when trying to find specific parts of the transaction I have to open each event and check if its the correct part, to make it easier I want to be able to include extra selected fields to show the description of the xml event.
I have extracted this field, but cant get it to show on the dashboard, it shows correctly when viewing it in search.
Query is sourcetype=[sourcetype] Description=* ActivityID=[activityid]
It currently shows like this on the dashboard
But I want it to show like this:
- Mark as New
- Bookmark Message
- Subscribe to Message
- Mute Message
- Subscribe to RSS Feed
- Permalink
- Report Inappropriate Content
add this to your dashboard:
<fields>Description, host, source, sourcetype</fields>
See here for example:
http://docs.splunk.com/Documentation/Splunk/7.0.0/Viz/PanelreferenceforSimplifiedXML#event
- Mark as New
- Bookmark Message
- Subscribe to Message
- Mute Message
- Subscribe to RSS Feed
- Permalink
- Report Inappropriate Content
Thank you, that worked perfectly!


