- Splunk Answers
- :
- Using Splunk
- :
- Dashboards & Visualizations
- :
- Re: How to add sparkline and trend time to a singl...
- Subscribe to RSS Feed
- Mark Topic as New
- Mark Topic as Read
- Float this Topic for Current User
- Bookmark Topic
- Subscribe to Topic
- Mute Topic
- Printer Friendly Page
- Mark as New
- Bookmark Message
- Subscribe to Message
- Mute Message
- Subscribe to RSS Feed
- Permalink
- Report Inappropriate Content
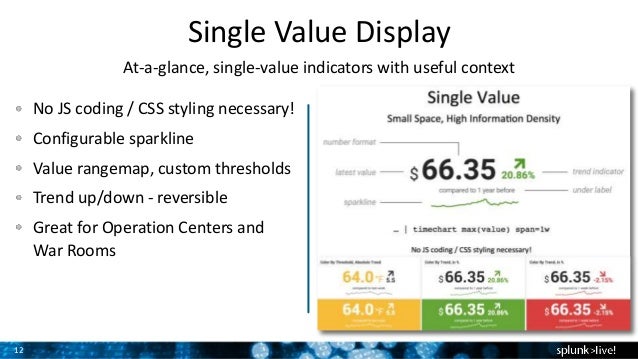
How to add sparkline and trend time to a single value visualization?
Hi,
I want to add a sparkline and trend time for a single value.
Can any one please help me how to do it? Below is the search string and source code.
Please correct this.
Thanks!
index=aws sourcetype=description alert_risk_level=high| stats count as alert_risk_level |eval alert_risk_level=($alert_risk_level$/1000)|eval alert_risk_level=round(alert_risk_level,2)
Source code
<panel>
  <single>
    <search>
      <query>index=aws sourcetype=description  | stats count as alert_risk_level  |eval alert_risk_level=($$alert_risk_level$$/1000)|eval alert_risk_level=round(alert_risk_level,2)</query>
      <earliest>-60m@m</earliest>
      <latest>now</latest>
      <sampleRatio>1</sampleRatio>
    </search>
    <option name="colorMode">none</option>
    <option name="drilldown">all</option>
    <option name="rangeColors">["0x65a637","0x040751"]</option>
    <option name="rangeValues">[0]</option>
    <option name="underLabel">Risk Identified</option>
    <option name="unit">K</option>
    <option name="unitPosition">after</option>
    <option name="useColors">1</option>
    <option name="useThousandSeparators">0</option>
  </single>
</panel>
<panel>
  <single>
- Mark as New
- Bookmark Message
- Subscribe to Message
- Mute Message
- Subscribe to RSS Feed
- Permalink
- Report Inappropriate Content
Please convert the query to timechart instead of stats.
<query>index=aws sourcetype=description | timechart count as alert_risk_level |eval alert_risk_level=($$alert_risk_level$$/1000)|eval alert_risk_level=round(alert_risk_level,2)</query>
You need to show Trend Indicator and Sparkline. You can do both of this directly from Splunk UI by Editing Single Value Properties from the Format menu. Unless you have already done, requesting you to get Splunk 6.x Dashboard Examples App from Splunkbase (https://splunkbase.splunk.com/app/1603/) also refer to customizing Single Value documentation http://docs.splunk.com/Documentation/Splunk/latest/Viz/SingleValueFormatting.
If you want to do it through Simple XML, please refer to the following Documentation:
look for trend related configurations and set showSparkline to true to show Spark Line.
https://docs.splunk.com/Documentation/Splunk/latest/Viz/PanelreferenceforSimplifiedXML#single_value
| makeresults | eval message= "Happy Splunking!!!"
- Mark as New
- Bookmark Message
- Subscribe to Message
- Mute Message
- Subscribe to RSS Feed
- Permalink
- Report Inappropriate Content
@dchalasani is there a reason you need to use sparkline instead of timechart ? Here is an example using timechart if you decide that is acceptable
index=aws sourcetype=description alert_risk_level=high | stats count as alert_risk_level by _time | eval alert_risk_level=alert_risk_level/1000 | eval alert_risk_level=round(alert_risk_level,2) | timechart span=1m max(alert_risk_level)
- Mark as New
- Bookmark Message
- Subscribe to Message
- Mute Message
- Subscribe to RSS Feed
- Permalink
- Report Inappropriate Content
Please open the above link.
Is this possible?
- Mark as New
- Bookmark Message
- Subscribe to Message
- Mute Message
- Subscribe to RSS Feed
- Permalink
- Report Inappropriate Content
And can we change in source-code for sparkline..
- Mark as New
- Bookmark Message
- Subscribe to Message
- Mute Message
- Subscribe to RSS Feed
- Permalink
- Report Inappropriate Content
here is source code example for single value element with sparkline and trend indicator:
<dashboard>
  <label>Single Value Element With Sparkline and Trend Indicator</label>
  <row>
    <panel>
      <single>
        <title>With Sparkline and Trend Indicator</title>
        <search>
          <query>index=aws sourcetype=description alert_risk_level=high | timechart count as alert_risk_level  | eval alert_risk_level=alert_risk_level/1000  | eval alert_risk_level=round(alert_risk_level,2) </query>
          <earliest>-24h@h</earliest>
          <latest>now</latest>
        </search>
        <option name="trendColorInterpretation">standard</option>
        <option name="trendDisplayMode">absolute</option>
        <option name="trendInterval">-1h</option>
        <option name="colorBy">value</option>
        <option name="colorMode">none</option>
        <option name="numberPrecision">0</option>
        <option name="showTrendIndicator">1</option>
        <option name="showSparkline">1</option>
        <option name="useColors">0</option>
        <option name="useThousandSeparators">1</option>
        <option name="underLabel">Compared to an hour before</option>
        <option name="drilldown">none</option>
      </single>
    </panel>

  </row>
</dashboard>
Introducing the 2024 SplunkTrust!
Introducing the 2024 Splunk MVPs!
Splunk Custom Visualizations App End of Life
