- Splunk Answers
- :
- Using Splunk
- :
- Dashboards & Visualizations
- :
- Re: How do you use custom XML in reports (from das...
- Subscribe to RSS Feed
- Mark Topic as New
- Mark Topic as Read
- Float this Topic for Current User
- Bookmark Topic
- Subscribe to Topic
- Mute Topic
- Printer Friendly Page
- Mark as New
- Bookmark Message
- Subscribe to Message
- Mute Message
- Subscribe to RSS Feed
- Permalink
- Report Inappropriate Content
How do you use custom XML in reports (from dashboard formatting)?
Hi everyone, I have made a bar graph that uses XML to make custom colors for two different series. I seem to lose the colors I set the series at whenever I convert to a report from my dashboard that uses the XML. I am only converting to a report so I can embed my display into an HTML file and ultimately on to the web.
1.) Can I do something to keep the XML formatting I have done in the dashboard?
2.) If not, does anyone know of a way to embed a dashboard?
I appreciate any input that anyone has!
- Mark as New
- Bookmark Message
- Subscribe to Message
- Mute Message
- Subscribe to RSS Feed
- Permalink
- Report Inappropriate Content
Embedding Report to Web Page with Field Colors

Following is a run anywhere Splunk Report based on Splunk _internal index. Scheduled to run every 15 min. Search is created just to mimic two days data as GREEN and RED respectively (no actual significance). Following setting in savedsearches.conf sets the field colors for saved report Embedded Report : display.visualizations.charting.fieldColors = {"GREEN":0x00FF00,"RED":0xFF0000}
[Embedded Report]
action.email.useNSSubject = 1
alert.track = 0
cron_schedule = */15 * * * *
dispatch.earliest_time = -24h@h
dispatch.latest_time = now
display.general.timeRangePicker.show = 0
display.general.type = visualizations
display.page.search.mode = fast
display.page.search.tab = visualizations
display.statistics.show = 0
display.visualizations.charting.fieldColors = {"RED":0xFF0000,"GREEN":0x00FF00}
embed.enabled = 1
enableSched = 1
request.ui_dispatch_app = search
request.ui_dispatch_view = search
search = index=_internal sourcetype=splunkd log_level="INFO" earliest=-1d@d latest=-1d@s \
|  timechart span=4h count as GREEN\
|  accum GREEN as GREEN\
|  append \
    [search index=_internal sourcetype=splunkd log_level="INFO"  earliest=-0d@d latest=@s \
     |  timechart span=4h count as "RED"\
     |  accum RED as RED]
From Splunk UI use Report -> Edit -> Embed option to Enable Embedding and generate the code for <iframe> to be used in your Web Page.
Following is the sample HTML code to Show Embedded Report (MyPageWithEmbeddedReport.html😞
<html>
    <head>
    <title>Splunk Embedded Report</title>
    </head>
    <body>
        <h2 style="text-align:center">Splunk Embedded Report</h2>
        <div>
            <iframe height="350px" width="100%" frameborder="0" src="<YOUR_EMBEDDED_REPORT_SOURCE>"></iframe>
        </div>
    <body>
</html>
Embedding Dashboard to Web Page with Field Colors (Not Recommended)

Step 1 : To enable Splunk URL to be used as iFrame, modify web.conf in $SPLUNK_HOME/etc/system/default folder (surprisingly it did not work with system/local folder)
x_frame_options_sameorigin = False
PS: Setting this option opens click-jacking attacks because of which this is not recommended. Refer to answer: https://answers.splunk.com/answers/104277/iframes-and-views-broken-after-splunk-6-upgrade.html
Following is the Run anywhere dashboard with same SPL as above.
Splunk App Bar and Menu Bar Header Footer and Title and Edit menu have been removed using following option: hideChrome="true" hideTitle="true" hideEdit="true"
Also Charting Field Colors has been applied using: <option name="charting.fieldColors">{"RED":0xFF0000,"GREEN":0x00FF00}</option>
<dashboard hideChrome="true" hideTitle="true" hideEdit="true">
  <label>Embed Dashboard</label>
  <row>
    <panel>
      <chart>
        <search>
          <query>index=_internal sourcetype=splunkd log_level="INFO" earliest=-1d@d latest=-1d@s
|  timechart span=4h count as GREEN
|  accum GREEN as GREEN
|  append
    [search index=_internal sourcetype=splunkd log_level="INFO"  earliest=-0d@d latest=@s
     |  timechart span=4h count as "RED"
     |  accum RED as RED]</query>
          <earliest>-24h@h</earliest>
          <latest>now</latest>
          <sampleRatio>1</sampleRatio>
        </search>
        <option name="charting.axisLabelsX.majorLabelStyle.overflowMode">ellipsisNone</option>
        <option name="charting.axisLabelsX.majorLabelStyle.rotation">0</option>
        <option name="charting.axisTitleX.visibility">visible</option>
        <option name="charting.axisTitleY.visibility">visible</option>
        <option name="charting.axisTitleY2.visibility">visible</option>
        <option name="charting.axisX.abbreviation">none</option>
        <option name="charting.axisX.scale">linear</option>
        <option name="charting.axisY.abbreviation">none</option>
        <option name="charting.axisY.scale">linear</option>
        <option name="charting.axisY2.abbreviation">none</option>
        <option name="charting.axisY2.enabled">0</option>
        <option name="charting.axisY2.scale">inherit</option>
        <option name="charting.chart">column</option>
        <option name="charting.chart.bubbleMaximumSize">50</option>
        <option name="charting.chart.bubbleMinimumSize">10</option>
        <option name="charting.chart.bubbleSizeBy">area</option>
        <option name="charting.chart.nullValueMode">gaps</option>
        <option name="charting.chart.showDataLabels">none</option>
        <option name="charting.chart.sliceCollapsingThreshold">0.01</option>
        <option name="charting.chart.stackMode">default</option>
        <option name="charting.chart.style">shiny</option>
        <option name="charting.drilldown">none</option>
        <option name="charting.fieldColors">{"RED":0xFF0000,"GREEN":0x00FF00}</option>
        <option name="charting.layout.splitSeries">0</option>
        <option name="charting.layout.splitSeries.allowIndependentYRanges">0</option>
        <option name="charting.legend.labelStyle.overflowMode">ellipsisMiddle</option>
        <option name="charting.legend.mode">standard</option>
        <option name="charting.legend.placement">right</option>
        <option name="charting.lineWidth">2</option>
        <option name="trellis.enabled">0</option>
        <option name="trellis.scales.shared">1</option>
        <option name="trellis.size">medium</option>
      </chart>
    </panel>
  </row>
</dashboard>
Following is a sample HTML (`MyPageWithEmbeddedDashboard.html)
<html>
<head>
</head>
<body>
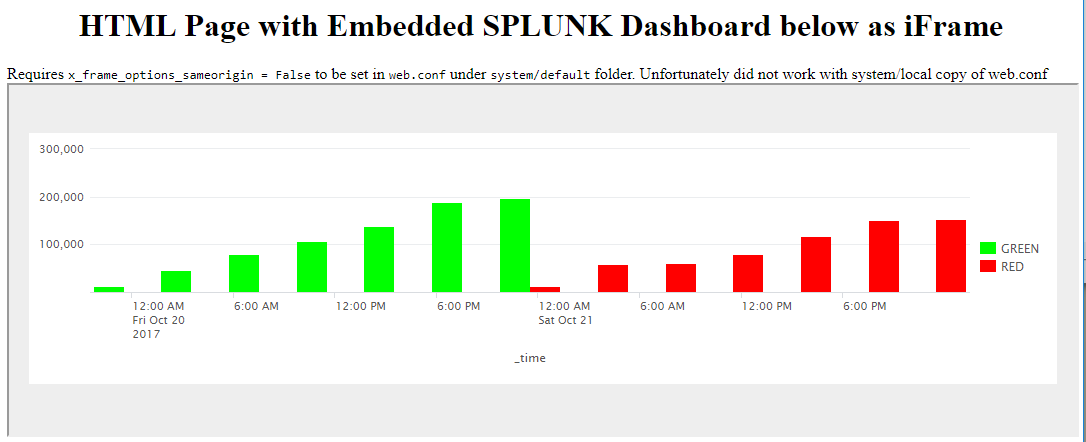
<h1 style="text-align:center;">HTML Page with Embedded SPLUNK Dashboard below as iFrame</h1>
<div>Requires <code>x_frame_options_sameorigin = False</code> to be set in <code>web.conf</code> under <code>system/default</code> folder. Unfortunately did not work with system/local copy of web.conf</div>
<iframe src="YOUR_SPLUNK_DASHBOARD_URL" height="350px" width="100%" scrolling="no" ></iframe>
</body>
</html>
| makeresults | eval message= "Happy Splunking!!!"
- Mark as New
- Bookmark Message
- Subscribe to Message
- Mute Message
- Subscribe to RSS Feed
- Permalink
- Report Inappropriate Content
@AYellowJacket,
If you have embedded report in Splunk and you need to pull the same in your webpage (https://www.splunk.com/blog/2014/05/08/17682.html), then you would need to identify the Report or Saved Search configuration file (i.e. savedsearches.conf) and apply display.visualizations.charting.fieldColors or display.visualizations.charting.seriesColors settings as per your need similar to Simple XML Chart Configuration reference.
(https://answers.splunk.com/answers/203932/setting-colors-on-embed-charts.html and https://docs.splunk.com/Documentation/Splunk/latest/Viz/ChartConfigurationReference#General_chart_pr...)
Typically if the Splunk app is search and you have created a saved search with App level read only permission for everyone (write permissions to required roles like power and admin). Then savedseaches.conf will be located under:
$SPLUNK_HOME/etc/apps/search/local/savedsearches.conf
Identify the entry with the Saved Search/Report name.
(i) Use fieldColors If you know the Field Names for example ERROR and WARN
display.visualizations.charting.fieldColors = {"ERROR":0xFF0000,"WARN":0xFFFF00}
(ii) Use seriesColorsif the sequence of series remains the same (number of series should be same or less than the number of series colors defined or else same color will get applied for multiple series)
display.visualizations.charting.seriesColors = [0xFF0000,0xFFFF00]
PS: This will require reboot/refresh of Splunk and also will be reflected in external page after subsequent run of Saved Search.
If you want to view dashboard within Splunk then you can enable x_frame_options_sameorigin in Splunk and then use iFrame to embed Splunk dashboard to your within Splunk. (https://answers.splunk.com/answers/104277/iframes-and-views-broken-after-splunk-6-upgrade.html)
| makeresults | eval message= "Happy Splunking!!!"
- Mark as New
- Bookmark Message
- Subscribe to Message
- Mute Message
- Subscribe to RSS Feed
- Permalink
- Report Inappropriate Content
Is this the only way? I saw another response from you about adding CSS to change colors, but I couldn't get it to work. I can get the CSS to change colors in the dashboard, but it won't carry across to the iframe.
- Mark as New
- Bookmark Message
- Subscribe to Message
- Mute Message
- Subscribe to RSS Feed
- Permalink
- Report Inappropriate Content
I answered this based on your question that you need to apply color on Report. Since you mentioned embedded report, I thought you not using dashboard.
If you are using iFrame then Simple XML Chart configuration option set in your dashboard should persist. Which version of Splunk are you using?
Are you using the following in your dashboard? Would you be able to add screenshot of dashboard or Simple XML code or both (if possible)?
<option name="charting.fieldColors">{"ERROR":0xFF0000,"WARN":0xFFFF00}</option>
Or
<option name="charting.seriesColors">[0xFF0000,0xFFFF00]</option>
I had answered a similar question a little while back for iFrames color: https://answers.splunk.com/answers/567846/embedded-dashboards-color-changes.html
Please let me know if your issue is similar and whether that answer applies to your use case as well or not.
| makeresults | eval message= "Happy Splunking!!!"
- Mark as New
- Bookmark Message
- Subscribe to Message
- Mute Message
- Subscribe to RSS Feed
- Permalink
- Report Inappropriate Content
Hi, yes that's the post I was referring to. I followed it exactly and couldn't get it to work in an iframe. The XML won't carry across, and neither will the CSS. Yes, I'm using fieldColors to turn some columns red and others green like below.
<option name="charting.fieldColors">{"red":0xFF0000,"green":0x00FF00}</option>
In my dashboard, they show red and green but in my report and iframe they show the default colors of blue and yellow. Also, I'm running 6.6.2.
- Mark as New
- Bookmark Message
- Subscribe to Message
- Mute Message
- Subscribe to RSS Feed
- Permalink
- Report Inappropriate Content
@esillar, I have converted my answer to comment. Would you be able to add your query/ screenshot for what is the color you expect in your embedded report?
@AYellowJacket, I just noticed original question was posted by you. Were you able to try the answer? Did it work for you?
| makeresults | eval message= "Happy Splunking!!!"
- Mark as New
- Bookmark Message
- Subscribe to Message
- Mute Message
- Subscribe to RSS Feed
- Permalink
- Report Inappropriate Content
So I start with a search with two fields in a column chart. The columns are represented with the blue and yellow default colors, as expected.

I save it to a dashboard and add XML to my panel.

When I view my panel in my dashboard, it goes from the default colors to green and red.

Then, I save the panel as a report so that I can embed it with an iframe. After that, I view the iframe on a html page. It goes back to blue and yellow.

- Mark as New
- Bookmark Message
- Subscribe to Message
- Mute Message
- Subscribe to RSS Feed
- Permalink
- Report Inappropriate Content
@esillar, if you want to embed Report you would need to configure color through savedsearches.conf as stated above.
If you are embedding dashboard as an iFrame (not report), then you would need to follow the other answer. It also requires x_frame_options_sameorigin set to False as stated in one of the comments with reference to respective Splunk Answer.
I will re-post both options as answer below. However, setting x_frame_options_sameorigin=False to enable Dashboard embedding to your web page is not recommended.
| makeresults | eval message= "Happy Splunking!!!"
- Mark as New
- Bookmark Message
- Subscribe to Message
- Mute Message
- Subscribe to RSS Feed
- Permalink
- Report Inappropriate Content
How do you embed a dashboard without saving it as a report and embedding it?
- Mark as New
- Bookmark Message
- Subscribe to Message
- Mute Message
- Subscribe to RSS Feed
- Permalink
- Report Inappropriate Content
@esillar, hope you have got the answer for embedding Dashboard with iFrame which is illustrated in the below answer as second (not recommended) option. Please let me know if something else is required.
| makeresults | eval message= "Happy Splunking!!!"
- Mark as New
- Bookmark Message
- Subscribe to Message
- Mute Message
- Subscribe to RSS Feed
- Permalink
- Report Inappropriate Content
It's still not working for me with the XML. That's why I ask what the distinction is between an embedded dashboard and an embedded report. In order to embed a dashboard panel, I must first convert it to a report and then embed that into a webpage.
- Mark as New
- Bookmark Message
- Subscribe to Message
- Mute Message
- Subscribe to RSS Feed
- Permalink
- Report Inappropriate Content
Dashboards and Reports are different and hence the approach is also different. If you are anyways trying to convert to Report and then embed, you can use the first option Embedding Report to Web Page with Field Colors. Essentially following steps have been listed:
1) You would need to save your Splunk Report.
2) Then modify `savedsearches.conf` to apply `fieldColors` or `seriesColors` based on which is applicable.
3) Verify that the change is reflecting in the Report.
4) If colors are changed, then Schedule the Report and then Get the Embedding link.
5) Try your test web page with Embedded Dashboard.
If it is not working for you please confirm which step. You can also try the run anywhere example, which actually worked for me (screenshots also attached below).
| makeresults | eval message= "Happy Splunking!!!"
- Mark as New
- Bookmark Message
- Subscribe to Message
- Mute Message
- Subscribe to RSS Feed
- Permalink
- Report Inappropriate Content
That method won't work for us since only a couple of people have access to the conf files. We would definitely need to follow the second solution. Can you list the steps of how I would embed a dashboard panel? I currently embed a dashboard panel by saving that panel as a report and then embedding. I'm unaware of another way.
- Mark as New
- Bookmark Message
- Subscribe to Message
- Mute Message
- Subscribe to RSS Feed
- Permalink
- Report Inappropriate Content
@esillar, for retaining colors in embedded dashboard using either one of the two options, you would need to modify one or the other .conf file.
So, since you are familiar with the option to save as report and then embed as iframe in external webpage, you should try to see if Splunk Admin can assist with the modification of savedsearches.conf file. The change will be specific to your Saved Search in your app and nothing else.
If you have complete control on your external page where you are embedding the report, you also have an option to modify DOM through jQuery and override the Colors in your external webpage. That would be complicated since SVG elements and CSS for the chart would be applied already. But a Web Developer can give that a try.
| makeresults | eval message= "Happy Splunking!!!"
Introducing the 2024 SplunkTrust!
Introducing the 2024 Splunk MVPs!
Splunk Custom Visualizations App End of Life
