- Splunk Answers
- :
- Using Splunk
- :
- Dashboards & Visualizations
- :
- How can I create a button switcher?
- Subscribe to RSS Feed
- Mark Topic as New
- Mark Topic as Read
- Float this Topic for Current User
- Bookmark Topic
- Subscribe to Topic
- Mute Topic
- Printer Friendly Page
- Mark as New
- Bookmark Message
- Subscribe to Message
- Mute Message
- Subscribe to RSS Feed
- Permalink
- Report Inappropriate Content
hi
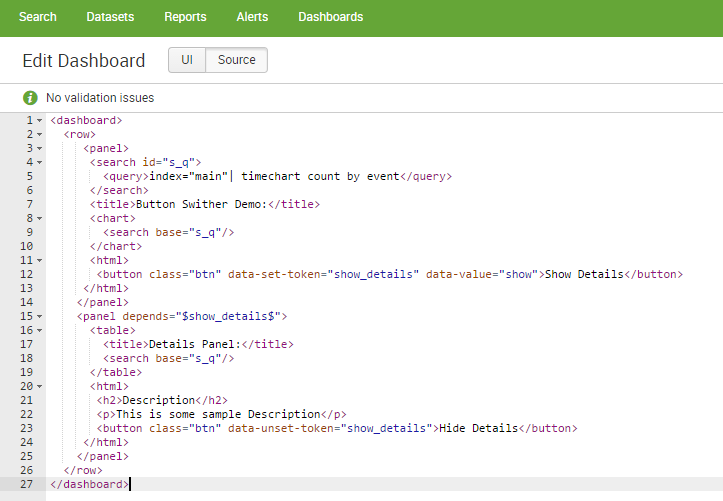
i want to create a button switcher here is my code in xml format:
but it dosent work, can you help me to know what is my problem
tanck you
- Mark as New
- Bookmark Message
- Subscribe to Message
- Mute Message
- Subscribe to RSS Feed
- Permalink
- Report Inappropriate Content
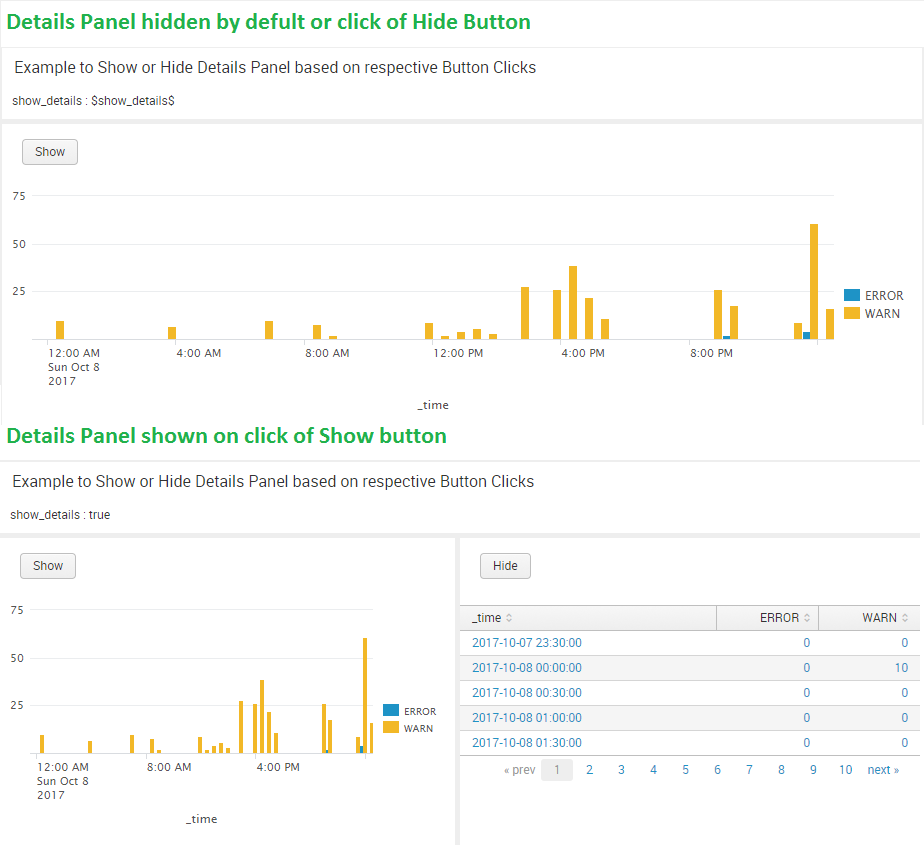
@khanlarloo, as stated by @rjthibod, the example that you are trying to implement is not a valid working example. You would need to use JavaScript to code click() events of Show and Hide buttons to set and unset required token using jQuery and Splunk JS Stack.
Following is a run anywhere example with require Dashboard Simple XML and JavaScript code. PS: I have give Show and Hide HTML buttons ids showButton and hideButton respectively to easily access through jQuery selector based on ids. You can create specific classes if you want to apply something similar on several buttons.
<dashboard script="button_click.js">
  <label>Button Switcher Example</label>
  <row>
    <panel>
      <title>Example to Show or Hide Details Panel based on respective Button Clicks</title>
      <html>
        show_details : $show_details$
      </html>
    </panel>
  </row>
  <row>
    <panel>
      <html>
        <button id="showButton" class="btn">Show</button>
      </html>
      <chart>
        <search>
          <query>index=_internal sourcetype=splunkd log_level!=INFO
| timechart count by log_level</query>
          <earliest>-24h@h</earliest>
          <latest>now</latest>
        </search>
        <option name="charting.chart">column</option>
        <option name="charting.drilldown">none</option>
        <option name="refresh.display">progressbar</option>
      </chart>
    </panel>
    <panel depends="$show_details$">
      <html>
        <button id="hideButton" class="btn">Hide</button>
      </html>
      <table>
        <search>
          <query>index=_internal sourcetype=splunkd log_level!=INFO
| timechart count by log_level</query>
          <earliest>-24h@h</earliest>
          <latest>now</latest>
        </search>
        <option name="count">5</option>
      </table>
    </panel>
  </row>
</dashboard>
And place the JavaScript button_click.js under your Splunk App's static folder i.e. $SPLUNK_HOME$/etc/apps/<YourAppName>/appserver/static:
require([
    "splunkjs/mvc",
    "splunkjs/mvc/simplexml/ready!"
], function(
            mvc
            ) {
        var defaultTokenModel = mvc.Components.get("default");
        var submittedTokenModel = mvc.Components.get("submitted");
        $("#showButton").click(function(){
            defaultTokenModel.set("show_details","true");
            submittedTokenModel.set("show_details","true");
        });
        $("#hideButton").click(function(){
            defaultTokenModel.unset("show_details");
            submittedTokenModel.unset("show_details");
        });
});
PS: Since this requires static file i.e. button_click.js, you might need to restart/refresh/bump Splunk and also clear internet browser cache for the changes to reflect.
If you also want to hide the Show button, when the Details panel is displayed and toggle back to show when Hide button in Details panel is clicked then you can add rejects attribute for the html panel containing Show button i.e.,
  <html rejects="$show_details$">
    <button id="showButton" class="btn">Show</button>
  </html>
| makeresults | eval message= "Happy Splunking!!!"
- Mark as New
- Bookmark Message
- Subscribe to Message
- Mute Message
- Subscribe to RSS Feed
- Permalink
- Report Inappropriate Content
Usually, you put the JavaScript and CSS files loaded by a dashboard in the folder appserver/static that is contained in the app folder for the app that the contains your dashboard. For example, if your app's folder is cool_dashboards, you would put the CSS and JavaScript loaded by the dashboard in the path: cool_dashboards/appserver/static.
More details are here: http://dev.splunk.com/view/webframework-developapps/SP-CAAAE4A
One thing the link is missing is what to do when you first install the JS/CSS files. The first time you load the files, you should restart Splunk in order for Splunk to find the files. After that, any time you change the JS/CSS files for the app, you need to tell Splunk to dump its cache using what's called a bump. You bump Splunk by going to http://<YOUR_SPLUNK_SERVER_WEB_ADDRESS_AND PORT>/en_US/_bump and clicking the button on that page. More info here: https://docs.splunk.com/Documentation/Splunk/latest/AdvancedDev/CustomizationOptions


