- Splunk Answers
- :
- Using Splunk
- :
- Dashboards & Visualizations
- :
- How to resolve these issues charting user time log...
- Subscribe to RSS Feed
- Mark Topic as New
- Mark Topic as Read
- Float this Topic for Current User
- Bookmark Topic
- Subscribe to Topic
- Mute Topic
- Printer Friendly Page
- Mark as New
- Bookmark Message
- Subscribe to Message
- Mute Message
- Subscribe to RSS Feed
- Permalink
- Report Inappropriate Content
How to resolve these issues charting user time logged in vs day of the week?
I'm trying to make a chart that shows me how long each individual is logged in, including weekends. This is for a closed system that only has a handful of users.
I'm using this search to get the data, but I'm having a very difficult time getting it to chart out in a useable way.
source="wineventlog:security" action=success Logon_Type=2 (EventCode=4624 OR EventCode=4634 OR EventCode=4779 OR EventCode=4800 OR EventCode=4801 OR EventCode=4802 OR EventCode=4803 OR EventCode=4804 ) user!="anonymous logon" user!="DWM-*" user!="UMFD-*" user!=SYSTEM user!=*$ (Logon_Type=2 OR Logon_Type=7 OR Logon_Type=10)
| convert timeformat="%a %B %d %Y" ctime(_time) AS Date
| streamstats earliest(_time) AS login, latest(_time) AS logout by Date, host
| eval session_duration=logout-login
| eval h=floor(session_duration/3600)
| eval m=floor((session_duration-(h*3600))/60)
| eval SessionDuration=h."h ".m."m "
| convert timeformat=" %m/%d/%y - %I:%M %P" ctime(login) AS login
| convert timeformat=" %m/%d/%y - %I:%M %P" ctime(logout) AS logout
| stats count AS auth_event_count, earliest(login) as login, max(SessionDuration) AS sesion_duration, latest(logout) as logout, values(Logon_Type) AS logon_types by Date, host, user
- Mark as New
- Bookmark Message
- Subscribe to Message
- Mute Message
- Subscribe to RSS Feed
- Permalink
- Report Inappropriate Content
Thanks for the quick reply. I'm not nearly proficient but I still can't get the graph to lay out the way I would like for a quick review.
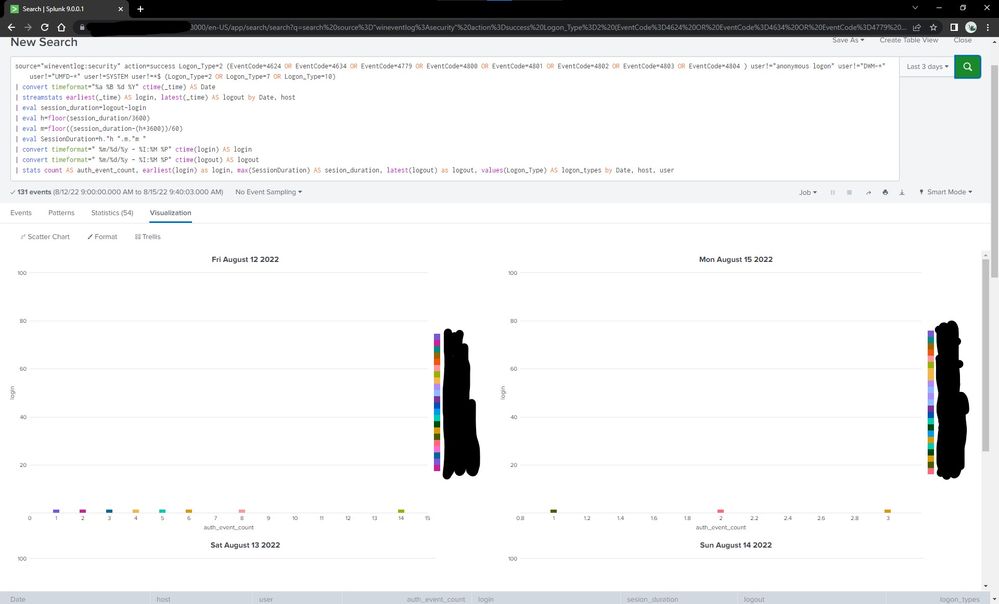
Using my code I get this trellis graph:
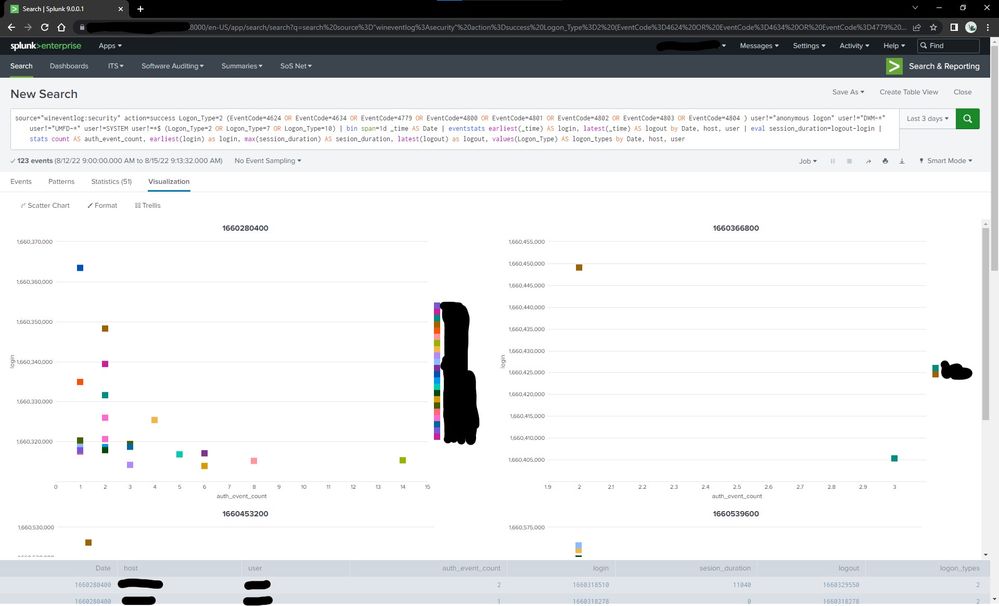
Using your code I got:
What I'm hoping to be able to produce on my dashboard is something like this:
Maybe I'm getting the right data and not visualizing it correctly?
A Trellis plot or scatter plot that lets us visualize when users are on the system so we can analyze for non-usual usage periods is where I'm trying to get to.
- Mark as New
- Bookmark Message
- Subscribe to Message
- Mute Message
- Subscribe to RSS Feed
- Permalink
- Report Inappropriate Content
Try something like this
source="wineventlog:security" action=success Logon_Type=2 (EventCode=4624 OR EventCode=4634 OR EventCode=4779 OR EventCode=4800 OR EventCode=4801 OR EventCode=4802 OR EventCode=4803 OR EventCode=4804 ) user!="anonymous logon" user!="DWM-*" user!="UMFD-*" user!=SYSTEM user!=*$ (Logon_Type=2 OR Logon_Type=7 OR Logon_Type=10)
| bin span=1d _time AS Date
| eventstats earliest(_time) AS login, latest(_time) AS logout by Date, host, user
| eval session_duration=logout-login
| stats count AS auth_event_count, earliest(login) as login, max(session_duration) AS sesion_duration, latest(logout) as logout, values(Logon_Type) AS logon_types by Date, host, user- Mark as New
- Bookmark Message
- Subscribe to Message
- Mute Message
- Subscribe to RSS Feed
- Permalink
- Report Inappropriate Content
Thank for the quick reply, this kind of set me back though so I'm not sure where to go with this from here. I've posted more info in this thread I just forgot to link it as a reply to your reply.


