Turn on suggestions
Auto-suggest helps you quickly narrow down your search results by suggesting possible matches as you type.
Showing results for
Dashboards & Visualizations
Turn on suggestions
Auto-suggest helps you quickly narrow down your search results by suggesting possible matches as you type.
Showing results for
- Splunk Answers
- :
- Using Splunk
- :
- Dashboards & Visualizations
- :
- Gantt Chart without SplunkBase plugins
Options
- Subscribe to RSS Feed
- Mark Topic as New
- Mark Topic as Read
- Float this Topic for Current User
- Bookmark Topic
- Subscribe to Topic
- Mute Topic
- Printer Friendly Page
- Mark as New
- Bookmark Message
- Subscribe to Message
- Mute Message
- Subscribe to RSS Feed
- Permalink
- Report Inappropriate Content
Gantt Chart without SplunkBase plugins
CarbonCriterium
Path Finder
09-02-2020
08:14 AM
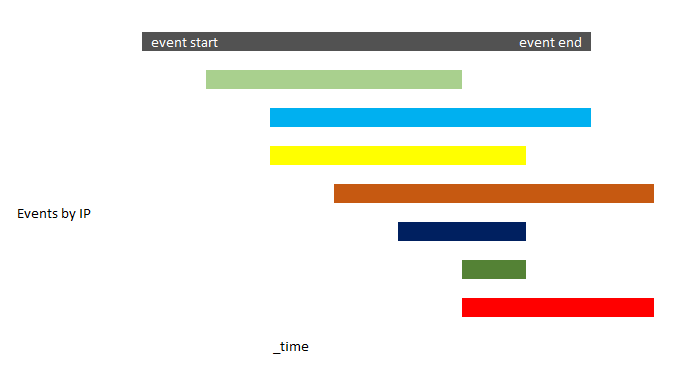
I am looking to visualize the start and end time of events by IP within a very narrow time frame.
The attached image show what I imagine the visualization to look like. I guess this would use the horizontal bar chart?
Can one create this type of visualization in Splunk without additional plugins?
- Mark as New
- Bookmark Message
- Subscribe to Message
- Mute Message
- Subscribe to RSS Feed
- Permalink
- Report Inappropriate Content
richgalloway

SplunkTrust
09-02-2020
08:28 AM
Splunk bar charts are always left-justified so they won't fill your need. There are apps available, however, to produce Gantt-style charts.
---
If this reply helps you, Karma would be appreciated.
If this reply helps you, Karma would be appreciated.
- Mark as New
- Bookmark Message
- Subscribe to Message
- Mute Message
- Subscribe to RSS Feed
- Permalink
- Report Inappropriate Content
CarbonCriterium
Path Finder
09-02-2020
09:25 AM
Thank you for the reply but it doesn't really help. I am looking to create a Gantt style chart without incorporating additional plugins or apps
Get Updates on the Splunk Community!
Webinar Recap | Revolutionizing IT Operations: The Transformative Power of AI and ML ...
The Transformative Power of AI and ML in Enhancing Observability
In the realm of IT operations, the ...
.conf24 | Registration Open!
Hello, hello! I come bearing good news: Registration for .conf24 is now open!
conf is Splunk’s rad annual ...
ICYMI - Check out the latest releases of Splunk Edge Processor
Splunk is pleased to announce the latest enhancements to Splunk Edge Processor.
HEC Receiver authorization ...
