Turn on suggestions
Auto-suggest helps you quickly narrow down your search results by suggesting possible matches as you type.
Showing results for
Dashboards & Visualizations
Turn on suggestions
Auto-suggest helps you quickly narrow down your search results by suggesting possible matches as you type.
Showing results for
- Splunk Answers
- :
- Using Splunk
- :
- Dashboards & Visualizations
- :
- Gantt Chart without SplunkBase plugins
Options
- Subscribe to RSS Feed
- Mark Topic as New
- Mark Topic as Read
- Float this Topic for Current User
- Bookmark Topic
- Subscribe to Topic
- Mute Topic
- Printer Friendly Page
- Mark as New
- Bookmark Message
- Subscribe to Message
- Mute Message
- Subscribe to RSS Feed
- Permalink
- Report Inappropriate Content
Gantt Chart without SplunkBase plugins
CarbonCriterium
Path Finder
09-02-2020
08:14 AM
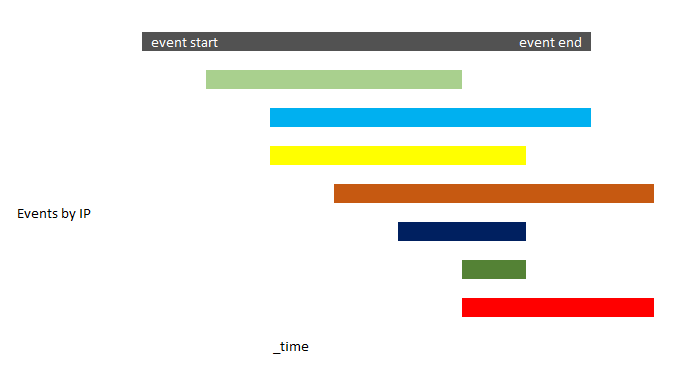
I am looking to visualize the start and end time of events by IP within a very narrow time frame.
The attached image show what I imagine the visualization to look like. I guess this would use the horizontal bar chart?
Can one create this type of visualization in Splunk without additional plugins?
- Mark as New
- Bookmark Message
- Subscribe to Message
- Mute Message
- Subscribe to RSS Feed
- Permalink
- Report Inappropriate Content
richgalloway

SplunkTrust
09-02-2020
08:28 AM
Splunk bar charts are always left-justified so they won't fill your need. There are apps available, however, to produce Gantt-style charts.
---
If this reply helps you, Karma would be appreciated.
If this reply helps you, Karma would be appreciated.
- Mark as New
- Bookmark Message
- Subscribe to Message
- Mute Message
- Subscribe to RSS Feed
- Permalink
- Report Inappropriate Content
CarbonCriterium
Path Finder
09-02-2020
09:25 AM
Thank you for the reply but it doesn't really help. I am looking to create a Gantt style chart without incorporating additional plugins or apps
Get Updates on the Splunk Community!
.conf24 | Registration Open!
Hello, hello! I come bearing good news: Registration for .conf24 is now open!
conf is Splunk’s rad annual ...
ICYMI - Check out the latest releases of Splunk Edge Processor
Splunk is pleased to announce the latest enhancements to Splunk Edge Processor.
HEC Receiver authorization ...
Introducing the 2024 SplunkTrust!
Hello, Splunk Community! We are beyond thrilled to announce our newest group of SplunkTrust members!
The ...
