- Splunk Answers
- :
- Using Splunk
- :
- Dashboards & Visualizations
- :
- Re: Dropdown input : Unable to get dynamic options...
- Subscribe to RSS Feed
- Mark Topic as New
- Mark Topic as Read
- Float this Topic for Current User
- Bookmark Topic
- Subscribe to Topic
- Mute Topic
- Printer Friendly Page
- Mark as New
- Bookmark Message
- Subscribe to Message
- Mute Message
- Subscribe to RSS Feed
- Permalink
- Report Inappropriate Content
Hello,
i' trying (without success...) to use a custom search to get the list of possible values of a field in a drill down input field of a Dashboard i'm working on.
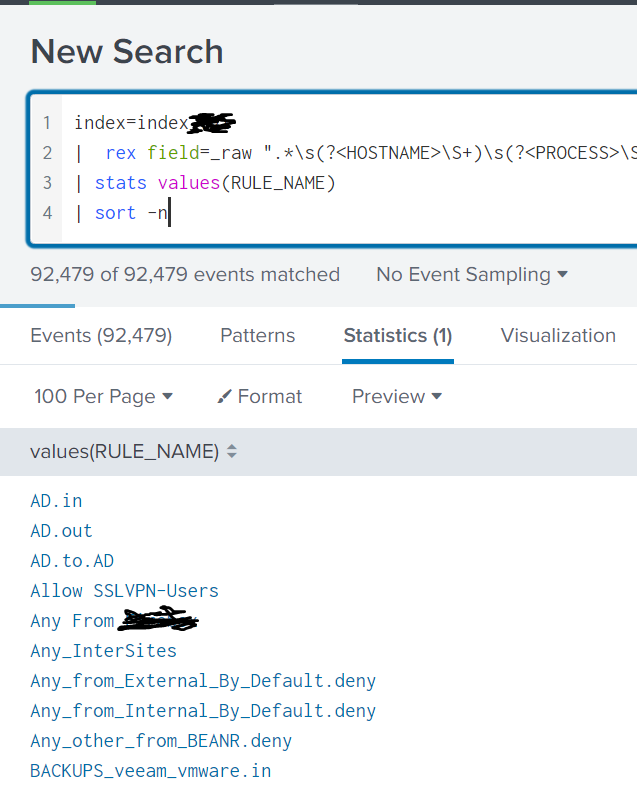
Here is the search i use to look at "exotic" Firewall logs and extract the possible RULE_NAME field values :
index=my_index
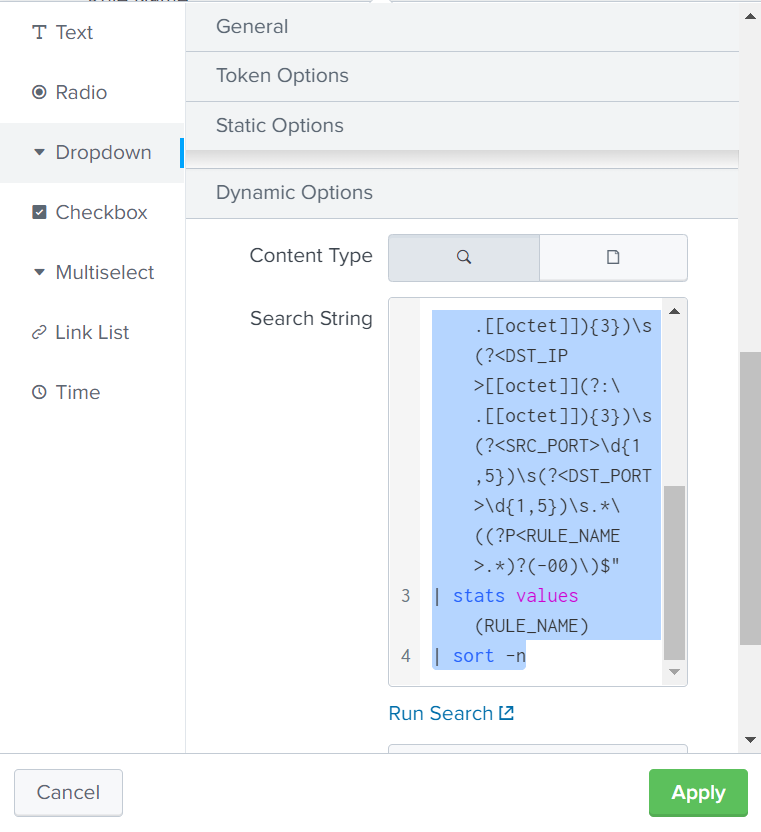
| rex field=_raw ".*\s(?<HOSTNAME>\S+)\s(?<PROCESS>\S+):\s.*\s(?<ACTION>(Allow|Deny))\s(?<SRC_INT>\S+)\s(?<DST_INT>\S+)\s.*(?<PR>(icmp|tcp|udp)).*\s(?<SRC_IP>[[octet]](?:\.[[octet]]){3})\s(?<DST_IP>[[octet]](?:\.[[octet]]){3})\s(?<SRC_PORT>\d{1,5})\s(?<DST_PORT>\d{1,5})\s.*\((?P<RULE_NAME>.*)?(-00)\)$"
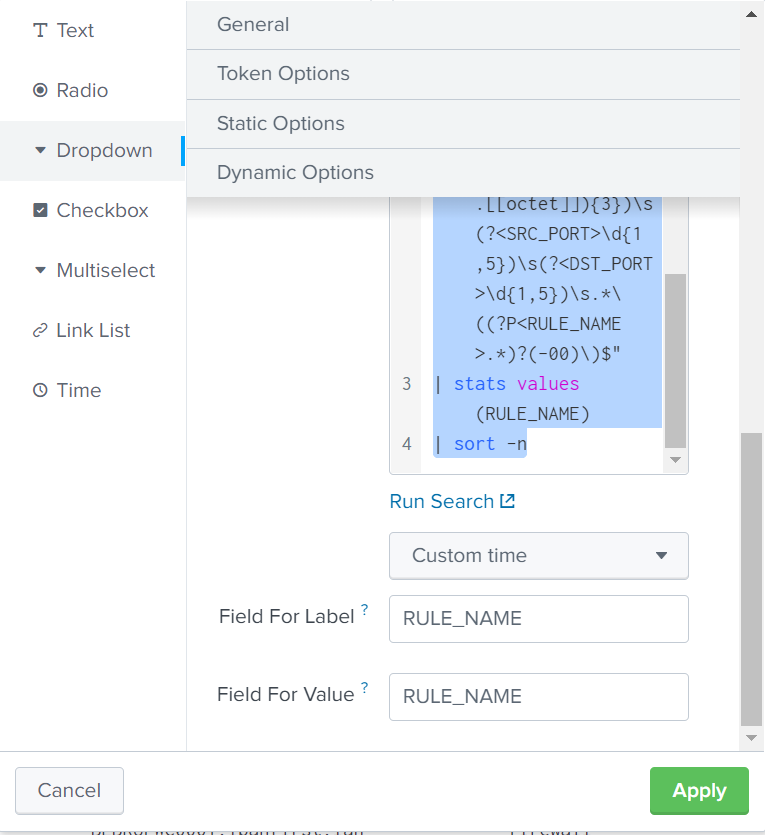
| stats values(RULE_NAME)
| sort -n
=> it is displaying with success what i need if i run it into a simple searh window.
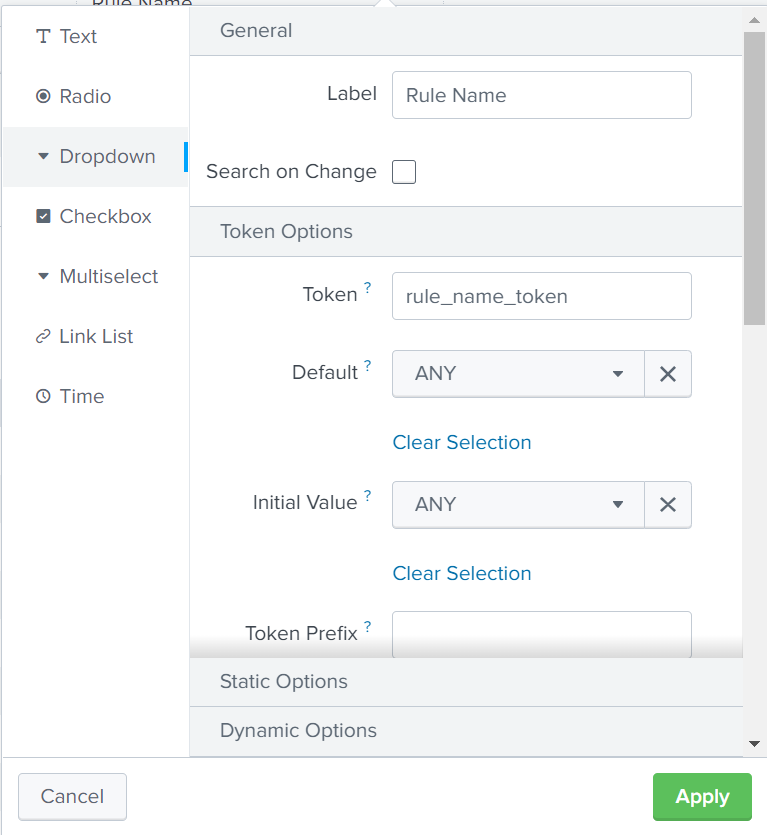
here is what i put in my fields of the Dropdown menu :
Input Type : Drop down
Label : Rule Name
Token : rule_name_token
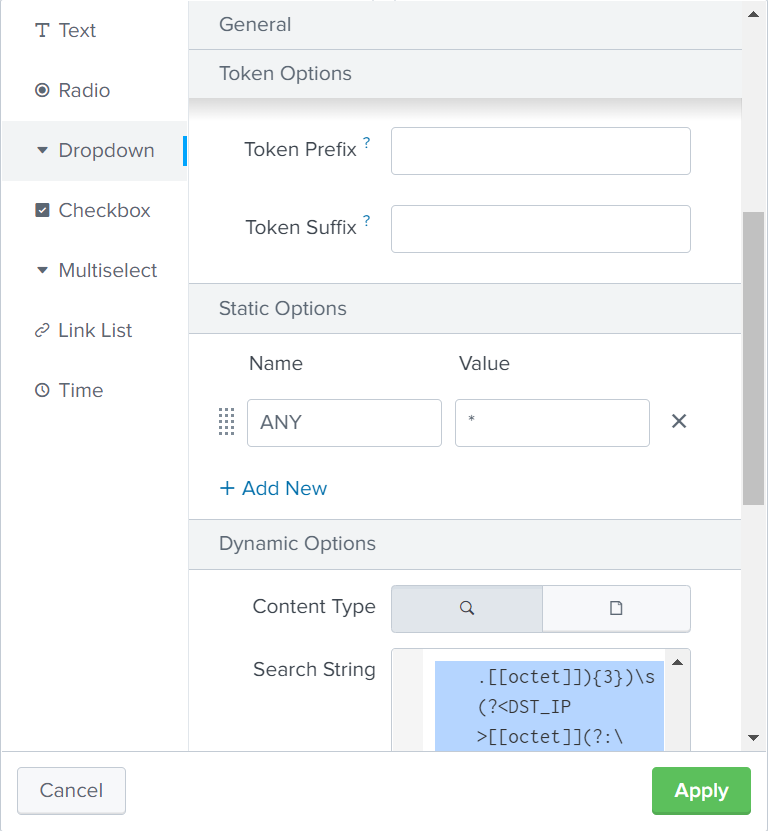
Created a STATIC OPTION named ANY with "*" as value (also set as default one)
Field For Label : RULE_NAME
Field For Value : RULE_NAME
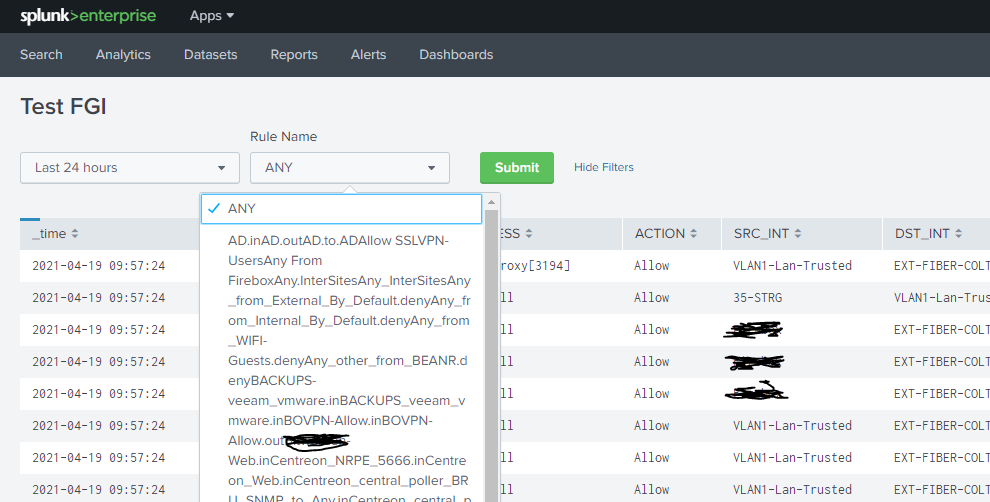
Problem : Nothing appears but ANY in my dropdown list (even if a can see briefly the "populating..." keywork displayed under this input dropdown menu during 1 second).
Any help please ? i certainly missed something ?
Thanks
Florent
- Mark as New
- Bookmark Message
- Subscribe to Message
- Mute Message
- Subscribe to RSS Feed
- Permalink
- Report Inappropriate Content
| stats values(RULE_NAME)will give you a multi-value field called "values(RULE_NAME)". You need separate events with each RULE_NAME. Try:
| stats count by RULE_NAME- Mark as New
- Bookmark Message
- Subscribe to Message
- Mute Message
- Subscribe to RSS Feed
- Permalink
- Report Inappropriate Content
Your stats values(RULE_NAME) will not leave a field called RULE_NAME, you need this
stats values(RULE_NAME) as RULE_NAMEso the field is RULE_NAME, otherwise the field name is 'values(RULE_NAME)'
- Mark as New
- Bookmark Message
- Subscribe to Message
- Mute Message
- Subscribe to RSS Feed
- Permalink
- Report Inappropriate Content
Hello, thanks for your reply, it now displays the results of my query, but everything is seen as the same result/value, i think something is still missing somewhere.
Any idea ?
thanks,
Florent
- Mark as New
- Bookmark Message
- Subscribe to Message
- Mute Message
- Subscribe to RSS Feed
- Permalink
- Report Inappropriate Content

