- Splunk Answers
- :
- Using Splunk
- :
- Dashboards & Visualizations
- :
- Dashboard panel time input based on another panel
- Subscribe to RSS Feed
- Mark Topic as New
- Mark Topic as Read
- Float this Topic for Current User
- Bookmark Topic
- Subscribe to Topic
- Mute Topic
- Printer Friendly Page
- Mark as New
- Bookmark Message
- Subscribe to Message
- Mute Message
- Subscribe to RSS Feed
- Permalink
- Report Inappropriate Content
Dashboard panel time input based on another panel
Hi all
I'm trying to create a dashboard panel with a time range that's based on (and can change depending on what I select for) another dashboard panel, and I'm having trouble figuring out how to do this . For example, if I have a dashboard panel with the search "index=system_A |stats count ip_address by hostname" set to run between 1 and 2PM today, I want to have that same search saved in another panel to run between 1 and 2 pm one week ago. If I change the time to run between noon and 6pm, then I would like the panel running the search for events a week ago to automatically change to run between noon and 6pm, seven days ago. So have it change depending on the time that's input for the first search to run (which I currently choose using a dropdown time picker). I'm a little stuck on how to do this, and would really appreciate any input.
Thanks in advance!
- Mark as New
- Bookmark Message
- Subscribe to Message
- Mute Message
- Subscribe to RSS Feed
- Permalink
- Report Inappropriate Content
Hi!
Here is a workaround I usually use, when I need to set calculated time range. But maybe it's possible to implement this simpler.
First of all, you should add addinfo command to your initial search: index=system_A |stats count ip_address by hostname | addinfo. This command adds several additional fields to your search results. We need info_min_time and info_max_time fields, they contains earliest and latest times (in UNIX time format) from the time range of this search.
Then you should calculate new time range based on these fields. Pay attention, that if your initial time range was "All time", info_max_time equals to "+Infinity", and your calculated info_min_time might be less than 0. So, your search might look like this:
index=system_A | stats count(ip_address) as cnt by hostname
| addinfo
| foreach info*time
  [eval <<FIELD>> = relative_time('<<FIELD>>', "-7d")]
| fillnull value=0 info_min_time
| fillnull value="" info_max_time
Then edit your dashboard source code. Add section done to the initial search, and option fields to the initial panel:
<panel>
      <table>
        <search>
          <query>index=system_A | stats count(ip_address) as cnt by hostname
| addinfo
| foreach info*time
  [eval <<FIELD>> = relative_time('<<FIELD>>', "-7d")]
| fillnull value=0 info_min_time
| fillnull value="" info_max_time</query>
          <earliest>$tokTime.earliest$</earliest>
          <latest>$tokTime.latest$</latest>
          <done>
            <set token="start">$result.info_min_time$</set>
            <set token="end">$result.info_max_time$</set>
          </done>
        </search>
        <fields>hostname, cnt</fields>
        <option name="refresh.display">progressbar</option>
      </table>
    </panel>
In fields you should specify the set of fields you want to display on your dashboard (so, you can hide info_min_time, info_max_time, etc.). In done section you set tokens start and end with calculated values from info_min_time and info_max_time.
All that's left is to set time range of your second panel with tokens start and end.
<panel>
      <chart>
        <search>
          <query>% your search%</query>
          <earliest>$start$</earliest>
          <latest>$end$</latest>
        </search>
      </chart>
    </panel>
That't it! Please let me know if you meet any difficulties or if you find a simpler way to implement this.
- Mark as New
- Bookmark Message
- Subscribe to Message
- Mute Message
- Subscribe to RSS Feed
- Permalink
- Report Inappropriate Content
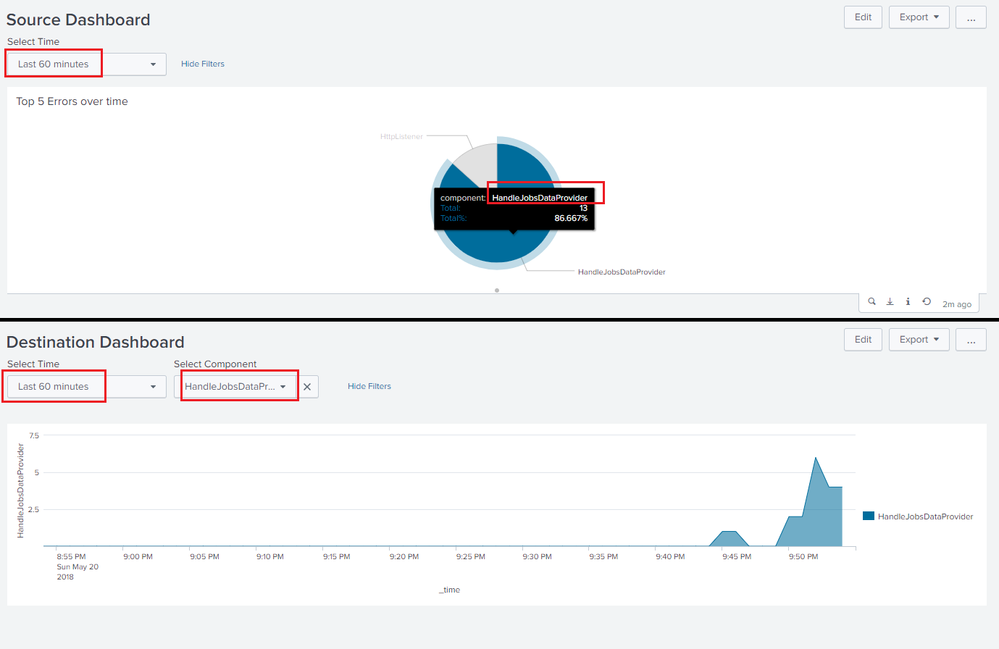
@afears you can have same Time input names in both the dashboard. For example, if time input name is tokTime in source dashboard, then tokTime should be the Time input in the second dashboard also.
While performing drilldown from source dashboard to destination dashboard, you can pass on the earliest and latest time from the source dashboard as form tokens used in the destination dashboard.
Following is a run anywhere example based on Splunk's _internal index, which passes the earliest and latest time along with selected component from source dashboard to the destination.
<drilldown>
<link target="_blank">/app/<yourSplunkAppName>/<yourDestinationDashboardName>?form.tokTime.earliest=$tokTime.earliest$&form.tokTime.latest=$tokTime.latest$&form.tokComponent=$click.value$</link>
</drilldown>
Following is the code for Source Dashboard (source_dashboard.xml under Splunk's default search app.):
<form>
<label>Source Dashboard</label>
<fieldset submitButton="false">
<input type="time" token="tokTime" searchWhenChanged="true">
<label>Select Time</label>
<default>
<earliest>-24h@h</earliest>
<latest>now</latest>
</default>
</input>
</fieldset>
<row>
<panel>
<title>Top 5 Errors over time</title>
<chart>
<search>
<query>index=_internal sourcetype=splunkd log_level!="INFO"
| timechart count by component limit=5 useother=f
| transpose 0 header_field=_time column_name=component
| search component!="_*"
| addcoltotals row=t col=f
| fields component Total</query>
<earliest>$tokTime.earliest$</earliest>
<latest>$tokTime.latest$</latest>
<sampleRatio>1</sampleRatio>
</search>
<option name="charting.axisLabelsX.majorLabelStyle.overflowMode">ellipsisNone</option>
<option name="charting.axisLabelsX.majorLabelStyle.rotation">0</option>
<option name="charting.axisTitleX.visibility">visible</option>
<option name="charting.axisTitleY.visibility">visible</option>
<option name="charting.axisTitleY2.visibility">visible</option>
<option name="charting.axisX.abbreviation">none</option>
<option name="charting.axisX.scale">linear</option>
<option name="charting.axisY.abbreviation">none</option>
<option name="charting.axisY.scale">linear</option>
<option name="charting.axisY2.abbreviation">none</option>
<option name="charting.axisY2.enabled">0</option>
<option name="charting.axisY2.scale">inherit</option>
<option name="charting.chart">pie</option>
<option name="charting.chart.bubbleMaximumSize">50</option>
<option name="charting.chart.bubbleMinimumSize">10</option>
<option name="charting.chart.bubbleSizeBy">area</option>
<option name="charting.chart.nullValueMode">gaps</option>
<option name="charting.chart.showDataLabels">none</option>
<option name="charting.chart.sliceCollapsingThreshold">0.01</option>
<option name="charting.chart.stackMode">default</option>
<option name="charting.chart.style">shiny</option>
<option name="charting.drilldown">all</option>
<option name="charting.layout.splitSeries">0</option>
<option name="charting.layout.splitSeries.allowIndependentYRanges">0</option>
<option name="charting.legend.labelStyle.overflowMode">ellipsisMiddle</option>
<option name="charting.legend.mode">standard</option>
<option name="charting.legend.placement">right</option>
<option name="charting.lineWidth">2</option>
<option name="refresh.display">progressbar</option>
<option name="trellis.enabled">0</option>
<option name="trellis.scales.shared">1</option>
<option name="trellis.size">medium</option>
<drilldown>
<link target="_blank">/app/search/destination_dashboard?form.tokTime.earliest=$tokTime.earliest$&form.tokTime.latest=$tokTime.latest$&form.tokComponent=$click.value$</link>
</drilldown>
</chart>
</panel>
</row>
</form>
Following is the Simple XML code for Destination Dashboard (destination_dashboard.xml under Splunk's default search app.)
<form>
  <label>Destination Dashboard</label>
  <fieldset submitButton="false">
    <input type="time" token="tokTime" searchWhenChanged="true">
      <label>Select Time</label>
      <default>
        <earliest>-24h@h</earliest>
        <latest>now</latest>
      </default>
    </input>
    <input type="dropdown" token="tokComponent" searchWhenChanged="true">
      <label>Select Component</label>
      <choice value="*">All</choice>
      <fieldForLabel>component</fieldForLabel>
      <fieldForValue>component</fieldForValue>
      <search>
        <query>index=_internal sourcetype=splunkd log_level!=INFO
| stats count by component</query>
        <earliest>-24h@h</earliest>
        <latest>now</latest>
      </search>
      <default>*</default>
    </input>
  </fieldset>
  <row>
    <panel>
      <chart>
        <search>
          <query>index=_internal sourcetype=splunkd log_level!="INFO" component="$tokComponent$"
|  timechart count by component limit=5 useother=f</query>
          <earliest>$tokTime.earliest$</earliest>
          <latest>$tokTime.latest$</latest>
          <sampleRatio>1</sampleRatio>
        </search>
        <option name="charting.axisLabelsX.majorLabelStyle.overflowMode">ellipsisNone</option>
        <option name="charting.axisLabelsX.majorLabelStyle.rotation">0</option>
        <option name="charting.axisTitleX.visibility">visible</option>
        <option name="charting.axisTitleY.visibility">visible</option>
        <option name="charting.axisTitleY2.visibility">visible</option>
        <option name="charting.axisX.abbreviation">none</option>
        <option name="charting.axisX.scale">linear</option>
        <option name="charting.axisY.abbreviation">none</option>
        <option name="charting.axisY.scale">linear</option>
        <option name="charting.axisY2.abbreviation">none</option>
        <option name="charting.axisY2.enabled">0</option>
        <option name="charting.axisY2.scale">inherit</option>
        <option name="charting.chart">area</option>
        <option name="charting.chart.bubbleMaximumSize">50</option>
        <option name="charting.chart.bubbleMinimumSize">10</option>
        <option name="charting.chart.bubbleSizeBy">area</option>
        <option name="charting.chart.nullValueMode">gaps</option>
        <option name="charting.chart.showDataLabels">none</option>
        <option name="charting.chart.sliceCollapsingThreshold">0.01</option>
        <option name="charting.chart.stackMode">default</option>
        <option name="charting.chart.style">shiny</option>
        <option name="charting.drilldown">none</option>
        <option name="charting.layout.splitSeries">0</option>
        <option name="charting.layout.splitSeries.allowIndependentYRanges">0</option>
        <option name="charting.legend.labelStyle.overflowMode">ellipsisMiddle</option>
        <option name="charting.legend.mode">standard</option>
        <option name="charting.legend.placement">right</option>
        <option name="charting.lineWidth">2</option>
        <option name="refresh.display">progressbar</option>
        <option name="trellis.enabled">0</option>
        <option name="trellis.scales.shared">1</option>
        <option name="trellis.size">medium</option>
      </chart>
    </panel>
  </row>
</form>
| makeresults | eval message= "Happy Splunking!!!"

