Turn on suggestions
Auto-suggest helps you quickly narrow down your search results by suggesting possible matches as you type.
Showing results for
Dashboards & Visualizations
Turn on suggestions
Auto-suggest helps you quickly narrow down your search results by suggesting possible matches as you type.
Showing results for
- Splunk Answers
- :
- Using Splunk
- :
- Dashboards & Visualizations
- :
- Dashboard customization - change 500, 504 to 5xx c...
Options
- Subscribe to RSS Feed
- Mark Topic as New
- Mark Topic as Read
- Float this Topic for Current User
- Bookmark Topic
- Subscribe to Topic
- Mute Topic
- Printer Friendly Page
- Mark as New
- Bookmark Message
- Subscribe to Message
- Mute Message
- Subscribe to RSS Feed
- Permalink
- Report Inappropriate Content
cmarrott
Explorer
06-30-2021
11:28 AM
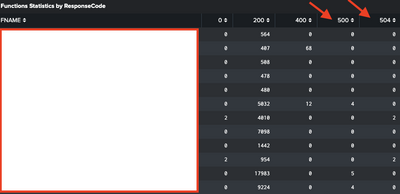
500 and 504 are shown here - but i'd like to condense them to one column="5xx" (same with 400, where all 4% responses would be shown under "4xx"
    <panel>
      <table>
        <title>Functions Statistics by ResponseCode</title>
        <search base="base_search3">
          <query>
            stats sum(count) as Count sum(S) as Success sum(F) as Failures avg(Avg_ResponseTime) as Average_ResponseTime by _time FNAME CODE |
            eval Availability=(Success/(Success+Failures))*100 |
            chart count by FNAME CODE
          </query>
        </search>
        <option name="count">15</option>
        <option name="drilldown">none</option>
        <option name="refresh.display">progressbar</option>
      </table>
    </panel>
the above is the relevant code
1 Solution
- Mark as New
- Bookmark Message
- Subscribe to Message
- Mute Message
- Subscribe to RSS Feed
- Permalink
- Report Inappropriate Content
richgalloway

SplunkTrust
06-30-2021
11:45 AM
Use eval to normalize the error codes before counting them.
<panel>
      <table>
        <title>Functions Statistics by ResponseCode</title>
        <search base="base_search3">
          <query>
            eval CODE=case(CODE/100=5, "5xx", CODE/100=4, "4xx", CODE/100=2, "2xx", 1==1,CODE)
            | stats sum(count) as Count sum(S) as Success sum(F) as Failures avg(Avg_ResponseTime) as Average_ResponseTime by _time FNAME CODE |
            eval Availability=(Success/(Success+Failures))*100 |
            chart count by FNAME CODE
          </query>
        </search>
        <option name="count">15</option>
        <option name="drilldown">none</option>
        <option name="refresh.display">progressbar</option>
      </table>
    </panel>
---
If this reply helps you, Karma would be appreciated.
If this reply helps you, Karma would be appreciated.
- Mark as New
- Bookmark Message
- Subscribe to Message
- Mute Message
- Subscribe to RSS Feed
- Permalink
- Report Inappropriate Content
richgalloway

SplunkTrust
06-30-2021
11:45 AM
Use eval to normalize the error codes before counting them.
<panel>
      <table>
        <title>Functions Statistics by ResponseCode</title>
        <search base="base_search3">
          <query>
            eval CODE=case(CODE/100=5, "5xx", CODE/100=4, "4xx", CODE/100=2, "2xx", 1==1,CODE)
            | stats sum(count) as Count sum(S) as Success sum(F) as Failures avg(Avg_ResponseTime) as Average_ResponseTime by _time FNAME CODE |
            eval Availability=(Success/(Success+Failures))*100 |
            chart count by FNAME CODE
          </query>
        </search>
        <option name="count">15</option>
        <option name="drilldown">none</option>
        <option name="refresh.display">progressbar</option>
      </table>
    </panel>
---
If this reply helps you, Karma would be appreciated.
If this reply helps you, Karma would be appreciated.
Get Updates on the Splunk Community!
Introducing Splunk Enterprise 9.2
WATCH HERE! Watch this Tech Talk to learn about the latest features and enhancements shipped in the new Splunk ...
Adoption of RUM and APM at Splunk
Unleash the power of Splunk Observability
Watch Now
In this can't miss Tech Talk! The Splunk Growth ...
Routing logs with Splunk OTel Collector for Kubernetes
The Splunk Distribution of the OpenTelemetry (OTel) Collector is a product that provides a way to ingest ...

