Dashboards & Visualizations

Count searches with results

Coffeebean
Explorer

Hey there,
I just started with splunk. Currently I'm testing the new dashboard studio feature.
I would like to count all searches with 1 or more found events on my dashboard.
In case of the attached picture, I would like to display 3 in the upper SingleValue field. If the search for Event 2 has 0 results, i would like to display a 2, and so on.

Coffeebean_0-1626879221988.png

Is there a simple and scalable solution to this, if I want to add more searches to the dashboard later on?

Thank you in advance!

Labels (1)
0 Karma

jhanvidattani
Path Finder

@Coffeebean 

Can you try the below solution?

<form>
  <init><set token="total_count">0</set></init>
  <search id="base">
    <query>index="_internal" | dedup host, source, sourcetype | table host, source, sourcetype</query>
    <earliest>$time_token.earliest$</earliest>
    <latest>$time_token.latest$</latest>
  </search>
  <label>Test Dashboard</label>
  <fieldset submitButton="false">
    <input type="time" token="time_token" searchWhenChanged="true">
      <label>Time Range</label>
      <default>
        <earliest>-4h@h</earliest>
        <latest>now</latest>
      </default>
    </input>
  </fieldset>
  <row depends="$never_show_this_panel$">
    <panel>
      <table>
        <title>Table</title>
        <search base="base">
          <query>| table source, sourcetype, host</query>
          <done>
            <condition match="isnotnull($result.source$) AND isnotnull($result.sourcetype$) AND isnotnull($result.host$)">
              <set token="total_count">3</set>
            </condition>
            <condition match="(isnotnull($result.source$) AND isnotnull($result.sourcetype$)) OR (isnotnull($result.source$) AND isnotnull($result.host$)) OR  (isnotnull($result.sourcetype$) AND isnotnull($result.host$))">
              <set token="total_count">2</set>
            </condition>
            <condition match="isnotnull($result.source$) OR isnotnull($result.sourcetype$) OR isnotnull($result.host$)">
              <set token="total_count">1</set>
            </condition>
        </done>
      </search>
        <option name="drilldown">none</option>
      </table>
    </panel>
  </row>
  <row>
    <panel>
      <single>
        <title>Panels Populated</title>
        <search>
          <query>| makeresults | eval total=$total_count$ </query>
        </search>
        <option name="drilldown">none</option>
      </single>
    </panel>
  </row>
  <row>
    <panel>
      <single>
        <title>Host</title>
        <search base="base">
          <query>| stats dc(host)</query>
        </search>
        <option name="drilldown">none</option>
        <option name="refresh.display">progressbar</option>
      </single>
    </panel>
    <panel>
      <single>
        <title>Source Type</title>
        <search base="base">
          <query>| stats dc(sourcetype)</query>
        </search>
        <option name="drilldown">none</option>
        <option name="refresh.display">progressbar</option>
      </single>
    </panel>
    <panel>
      <single>
        <title>Source</title>
        <search base="base">
          <query>| stats dc(source)</query>
        </search>
        <option name="drilldown">none</option>
      </single>
    </panel>
  </row>
</form>


If you find a solution fruitful, then an upvote and acceptance of the answer would be appreciated.


Coffeebean
Explorer

@jhanvidattani 
Thanks for the answer, but that looks like a XML solution.
As i tried this method with Dashboard Studio, which doesn't support XML, this will probably not work.

I will try to redesign my project with the old Dashboard builder.

0 Karma

MMahlberg
Explorer

Sure, it can be done but you have to do it in one query and then select the fields in the field selector. Try this:
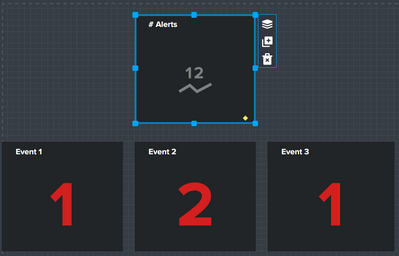
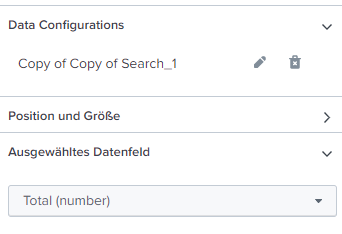
MMahlberg_0-1627982082155.png


{
    "visualizations": {
        "viz_L1aSlLpB": {
            "type""splunk.singlevalue",
            "dataSources": {
                "primary""ds_HbMCf42K"
            },
            "title""field1"
        },
        "viz_gpsfTDga": {
            "type""splunk.singlevalue",
            "options": {
                "majorValue""> sparklineValues | lastPoint()",
                "trendValue""> sparklineValues | delta(-2)",
                "sparklineValues""> primary | seriesByName('field3')"
            },
            "dataSources": {
                "primary""ds_HOFmRc1r_ds_HbMCf42K"
            },
            "title""field3"
        },
        "viz_gAmWIokL": {
            "type""splunk.singlevalue",
            "options": {
                "majorValue""> sparklineValues | lastPoint()",
                "trendValue""> sparklineValues | delta(-2)",
                "sparklineValues""> primary | seriesByName('field2')"
            },
            "dataSources": {
                "primary""ds_Epg28xu5_ds_HOFmRc1r_ds_HbMCf42K"
            },
            "title""field2"
        },
        "viz_3gzCc3Pv": {
            "type""splunk.singlevalue",
            "options": {
                "majorValue""> sparklineValues | lastPoint()",
                "trendValue""> sparklineValues | delta(-2)",
                "sparklineValues""> primary | seriesByName('Total')"
            },
            "dataSources": {
                "primary""ds_WVxE4sTM_ds_HOFmRc1r_ds_HbMCf42K"
            },
            "title""total"
        }
    },
    "dataSources": {
        "ds_HbMCf42K": {
            "type""ds.search",
            "options": {
                "query""| makeresults\n| fields - _time\n| eval field1= 1\n| eval field2= 2\n| eval field3= 3\n| addtotals"
            },
            "name""Search_1"
        },
        "ds_HOFmRc1r_ds_HbMCf42K": {
            "type""ds.search",
            "options": {
                "query""| makeresults\n| fields - _time\n| eval field1= 1\n| eval field2= 2\n| eval field3= 3\n| addtotals"
            },
            "name""Copy of Search_1"
        },
        "ds_Epg28xu5_ds_HOFmRc1r_ds_HbMCf42K": {
            "type""ds.search",
            "options": {
                "query""| makeresults\n| fields - _time\n| eval field1= 1\n| eval field2= 2\n| eval field3= 3\n| addtotals"
            },
            "name""Copy of Copy of Search_1"
        },
        "ds_WVxE4sTM_ds_HOFmRc1r_ds_HbMCf42K": {
            "type""ds.search",
            "options": {
                "query""| makeresults\n| fields - _time\n| eval field1= 1\n| eval field2= 2\n| eval field3= 3\n| addtotals"
            },
            "name""Copy of Copy of Search_1"
        },
        "ds_6sMlf8EL_ds_Epg28xu5_ds_HOFmRc1r_ds_HbMCf42K": {
            "type""ds.search",
            "options": {
                "query""| makeresults\n| fields - _time\n| eval field1= 1\n| eval field2= 2\n| eval field3= 3\n| addtotals"
            },
            "name""Copy of Copy of Copy of Search_1"
        }
    },
    "defaults": {
        "dataSources": {
            "ds.search": {
                "options": {
                    "queryParameters": {
                        "latest""$global_time.latest$",
                        "earliest""$global_time.earliest$"
                    }
                }
            }
        }
    },
    "inputs": {
        "input_global_trp": {
            "type""input.timerange",
            "options": {
                "token""global_time",
                "defaultValue""-24h@h,now"
            },
            "title""Globale Zeitspanne"
        }
    },
    "layout": {
        "type""absolute",
        "options": {
            "display""auto-scale"
        },
        "structure": [
            {
                "item""viz_L1aSlLpB",
                "type""block",
                "position": {
                    "x"120,
                    "y"160,
                    "w"200,
                    "h"130
                }
            },
            {
                "item""viz_gpsfTDga",
                "type""block",
                "position": {
                    "x"550,
                    "y"160,
                    "w"200,
                    "h"130
                }
            },
            {
                "item""viz_gAmWIokL",
                "type""block",
                "position": {
                    "x"340,
                    "y"160,
                    "w"200,
                    "h"130
                }
            },
            {
                "item""viz_3gzCc3Pv",
                "type""block",
                "position": {
                    "x"340,
                    "y"10,
                    "w"200,
                    "h"130
                }
            }
        ],
        "globalInputs": [
            "input_global_trp"
        ]
    },
    "description""",
    "title""test"
}
0 Karma
Get Updates on the Splunk Community!

Announcing Scheduled Export GA for Dashboard Studio

We're excited to announce the general availability of Scheduled Export for Dashboard Studio. Starting in ...

Extending Observability Content to Splunk Cloud

Watch Now!   In this Extending Observability Content to Splunk Cloud Tech Talk, you'll see how to leverage ...

More Control Over Your Monitoring Costs with Archived Metrics GA in US-AWS!

What if there was a way you could keep all the metrics data you need while saving on storage costs?This is now ...