- Splunk Answers
- :
- Using Splunk
- :
- Dashboards & Visualizations
- :
- Can annotations be be added manually without timec...
- Subscribe to RSS Feed
- Mark Topic as New
- Mark Topic as Read
- Float this Topic for Current User
- Bookmark Topic
- Subscribe to Topic
- Mute Topic
- Printer Friendly Page
- Mark as New
- Bookmark Message
- Subscribe to Message
- Mute Message
- Subscribe to RSS Feed
- Permalink
- Report Inappropriate Content
Hi there,
Say I wanted to add a marker for points of interest on a chart - is there a way to accomplish something like this - similar to annotations but not restricted to timechart, or do annotations only work with timechart?
Thanks!
- Mark as New
- Bookmark Message
- Subscribe to Message
- Mute Message
- Subscribe to RSS Feed
- Permalink
- Report Inappropriate Content
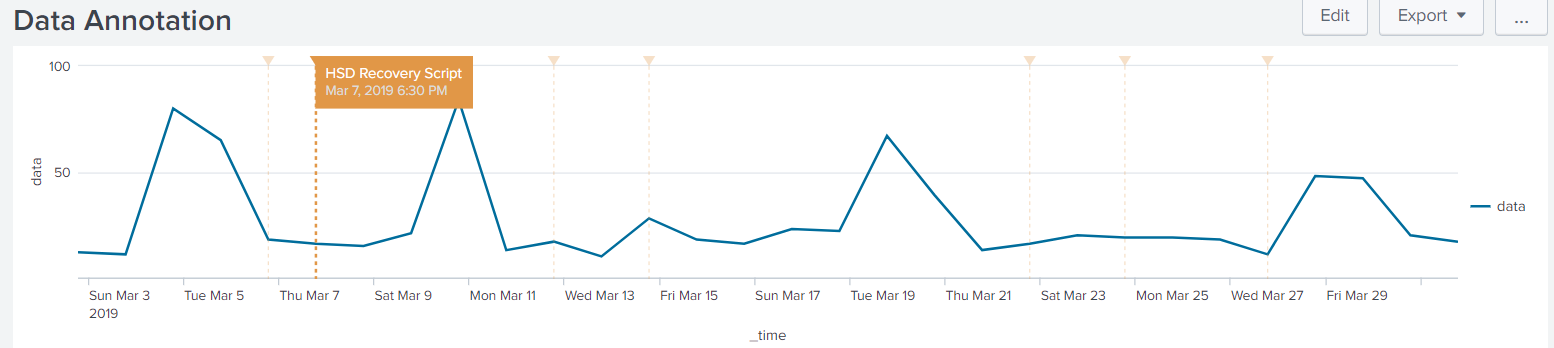
Can you try the following run anywhere dashboard? First search generate Chart using run anywhere search and second creates a search with several annotation events.

<dashboard>
  <label>Data Annotation</label>
  <row>
    <panel>
      <chart>
        <!-- Search to generate chart based on Raw Data search -->
        <search>
          <query>| gentimes start=-30
| eval _time=starttime
| fields _time
| eval data=random()
| eval data=substr(data,1,2)</query>
          <sampleRatio>1</sampleRatio>
        </search>
        <!-- Secondary search that drives the annotations -->
        <search type="annotation">
          <query>| makeresults
| eval _time=relative_time(now(),"-26d@d"), message="MR3 BUG FIX", type="type1"
| append
    [| makeresults
    | eval _time=relative_time(now(),"-25d@d"), message="HSD Recovery Script", type="type1"]
| append
    [| makeresults
    | eval _time=relative_time(now(),"-20d@d"), message="Something else", type="type1"]
| append
    [| makeresults
    | eval _time=relative_time(now(),"-18d@d"), message="Something new", type="type1"]
| append
    [| makeresults
    | eval _time=relative_time(now(),"-10d@d"), message="ABCD Test", type="type1"]
| append
    [| makeresults
    | eval _time=relative_time(now(),"-8d@d"), message="Blah Blah", type="type1"]
| append
    [| makeresults
    | eval _time=relative_time(now(),"-5d@d"), message="Marco Polo", type="type1"]
| eval annotation_label = message</query>
        </search>
        <!-- Customize the event annotation colors based on category name -->
        <option name="charting.annotation.categoryColors">{"type1":"0xffcc00"}</option>
        <option name="charting.axisLabelsX.majorLabelStyle.overflowMode">ellipsisNone</option>
        <option name="charting.axisLabelsX.majorLabelStyle.rotation">0</option>
        <option name="charting.axisTitleX.visibility">visible</option>
        <option name="charting.axisTitleY.visibility">visible</option>
        <option name="charting.axisTitleY2.visibility">visible</option>
        <option name="charting.axisX.abbreviation">none</option>
        <option name="charting.axisX.scale">linear</option>
        <option name="charting.axisY.abbreviation">none</option>
        <option name="charting.axisY.scale">linear</option>
        <option name="charting.axisY2.abbreviation">none</option>
        <option name="charting.axisY2.enabled">0</option>
        <option name="charting.axisY2.scale">inherit</option>
        <option name="charting.chart">line</option>
        <option name="charting.chart.bubbleMaximumSize">50</option>
        <option name="charting.chart.bubbleMinimumSize">10</option>
        <option name="charting.chart.bubbleSizeBy">area</option>
        <option name="charting.chart.nullValueMode">gaps</option>
        <option name="charting.chart.showDataLabels">none</option>
        <option name="charting.chart.sliceCollapsingThreshold">0.01</option>
        <option name="charting.chart.stackMode">default</option>
        <option name="charting.chart.style">shiny</option>
        <option name="charting.drilldown">none</option>
        <option name="charting.layout.splitSeries">0</option>
        <option name="charting.layout.splitSeries.allowIndependentYRanges">0</option>
        <option name="charting.legend.labelStyle.overflowMode">ellipsisMiddle</option>
        <option name="charting.legend.mode">standard</option>
        <option name="charting.legend.placement">right</option>
        <option name="charting.lineWidth">2</option>
        <option name="trellis.enabled">0</option>
        <option name="trellis.scales.shared">1</option>
        <option name="trellis.size">medium</option>
      </chart>
    </panel>
  </row>
</dashboard>
| makeresults | eval message= "Happy Splunking!!!"
- Mark as New
- Bookmark Message
- Subscribe to Message
- Mute Message
- Subscribe to RSS Feed
- Permalink
- Report Inappropriate Content
Can you try the following run anywhere dashboard? First search generate Chart using run anywhere search and second creates a search with several annotation events.
<dashboard>
  <label>Data Annotation</label>
  <row>
    <panel>
      <chart>
        <!-- Search to generate chart based on Raw Data search -->
        <search>
          <query>| gentimes start=-30
| eval _time=starttime
| fields _time
| eval data=random()
| eval data=substr(data,1,2)</query>
          <sampleRatio>1</sampleRatio>
        </search>
        <!-- Secondary search that drives the annotations -->
        <search type="annotation">
          <query>| makeresults
| eval _time=relative_time(now(),"-26d@d"), message="MR3 BUG FIX", type="type1"
| append
    [| makeresults
    | eval _time=relative_time(now(),"-25d@d"), message="HSD Recovery Script", type="type1"]
| append
    [| makeresults
    | eval _time=relative_time(now(),"-20d@d"), message="Something else", type="type1"]
| append
    [| makeresults
    | eval _time=relative_time(now(),"-18d@d"), message="Something new", type="type1"]
| append
    [| makeresults
    | eval _time=relative_time(now(),"-10d@d"), message="ABCD Test", type="type1"]
| append
    [| makeresults
    | eval _time=relative_time(now(),"-8d@d"), message="Blah Blah", type="type1"]
| append
    [| makeresults
    | eval _time=relative_time(now(),"-5d@d"), message="Marco Polo", type="type1"]
| eval annotation_label = message</query>
        </search>
        <!-- Customize the event annotation colors based on category name -->
        <option name="charting.annotation.categoryColors">{"type1":"0xffcc00"}</option>
        <option name="charting.axisLabelsX.majorLabelStyle.overflowMode">ellipsisNone</option>
        <option name="charting.axisLabelsX.majorLabelStyle.rotation">0</option>
        <option name="charting.axisTitleX.visibility">visible</option>
        <option name="charting.axisTitleY.visibility">visible</option>
        <option name="charting.axisTitleY2.visibility">visible</option>
        <option name="charting.axisX.abbreviation">none</option>
        <option name="charting.axisX.scale">linear</option>
        <option name="charting.axisY.abbreviation">none</option>
        <option name="charting.axisY.scale">linear</option>
        <option name="charting.axisY2.abbreviation">none</option>
        <option name="charting.axisY2.enabled">0</option>
        <option name="charting.axisY2.scale">inherit</option>
        <option name="charting.chart">line</option>
        <option name="charting.chart.bubbleMaximumSize">50</option>
        <option name="charting.chart.bubbleMinimumSize">10</option>
        <option name="charting.chart.bubbleSizeBy">area</option>
        <option name="charting.chart.nullValueMode">gaps</option>
        <option name="charting.chart.showDataLabels">none</option>
        <option name="charting.chart.sliceCollapsingThreshold">0.01</option>
        <option name="charting.chart.stackMode">default</option>
        <option name="charting.chart.style">shiny</option>
        <option name="charting.drilldown">none</option>
        <option name="charting.layout.splitSeries">0</option>
        <option name="charting.layout.splitSeries.allowIndependentYRanges">0</option>
        <option name="charting.legend.labelStyle.overflowMode">ellipsisMiddle</option>
        <option name="charting.legend.mode">standard</option>
        <option name="charting.legend.placement">right</option>
        <option name="charting.lineWidth">2</option>
        <option name="trellis.enabled">0</option>
        <option name="trellis.scales.shared">1</option>
        <option name="trellis.size">medium</option>
      </chart>
    </panel>
  </row>
</dashboard>
| makeresults | eval message= "Happy Splunking!!!"
- Mark as New
- Bookmark Message
- Subscribe to Message
- Mute Message
- Subscribe to RSS Feed
- Permalink
- Report Inappropriate Content
@niketnilay - Great sample, very helpful. I was trying to change the annotation colors, and found that to show use of annotation colors, you need to make the following three changes:
In middle of query, change these two to "type2":
 | append
     [| makeresults
     | eval _time=relative_time(now(),"-20d@d"), message="Something else", type="type2"]
 | append
     [| makeresults
     | eval _time=relative_time(now(),"-18d@d"), message="Something new", type="type2"]
At end of query, add this line:
| eval annotation_category = type
In options, update this line:
<option name="charting.annotation.categoryColors">{"type1":"0xffcc00","type2":"0x00ccff"}</option>
That way, you end up with two light blue annotations as well as the orange ones.
- Mark as New
- Bookmark Message
- Subscribe to Message
- Mute Message
- Subscribe to RSS Feed
- Permalink
- Report Inappropriate Content
Yes indeed 🙂
| makeresults | eval message= "Happy Splunking!!!"
- Mark as New
- Bookmark Message
- Subscribe to Message
- Mute Message
- Subscribe to RSS Feed
- Permalink
- Report Inappropriate Content
Excellent!
- Mark as New
- Bookmark Message
- Subscribe to Message
- Mute Message
- Subscribe to RSS Feed
- Permalink
- Report Inappropriate Content
Thanks alot!
- Mark as New
- Bookmark Message
- Subscribe to Message
- Mute Message
- Subscribe to RSS Feed
- Permalink
- Report Inappropriate Content
@mwdbhyat can you add an image of your requirement. If case of sensitive information just add a mock image (paint or White board) of what you need?
Refer to one of my previous answers where I had added Vertical and Horizontal lines to a scatter chart using CSS extension: https://answers.splunk.com/answers/681701/how-to-add-division-line-on-the-scatter-chart.html
| makeresults | eval message= "Happy Splunking!!!"
- Mark as New
- Bookmark Message
- Subscribe to Message
- Mute Message
- Subscribe to RSS Feed
- Permalink
- Report Inappropriate Content
@niketnilay thanks for getting back to me!..Its pretty much the same as what you answered in that question above.. however:
- - Is there a way to annotate manually based on a table - EG - I build a | table with _time, comment - this can then populate the chart at the time specified in the table, with the comment associated with it(think ES workflow where the analyst pastes a note/comment at a certain time -- except this is a much poorer version 🙂 )
- The other thing im looking to do with annotations is to highlight a specified day.. like tell me when today is, or last monday(but not on a timechart - just a normal chart)
Do you have any thoughts on this?
- Mark as New
- Bookmark Message
- Subscribe to Message
- Mute Message
- Subscribe to RSS Feed
- Permalink
- Report Inappropriate Content
@mwdbhyat if you have Time on x-axis, Event Annotation should be able to handle both the above scenarios. You don't need CSS override!
For second one, you need a dummy search, to generate specific date as _time (epoch time) field and dummy data for annotation. You can do this easily with | makeresults and relative_time() in case you need annotation not for current _time but a different data. Finally eval the annotation fields with static message you want.
In case you need help with that you would need to provide mock as requested.
| makeresults | eval message= "Happy Splunking!!!"
- Mark as New
- Bookmark Message
- Subscribe to Message
- Mute Message
- Subscribe to RSS Feed
- Permalink
- Report Inappropriate Content
@niketnilay this is kinda what im looking for the first scenario:

So the table would populate those line markers/annotations based on the user inputting the time and comment that they have for them.
- Mark as New
- Bookmark Message
- Subscribe to Message
- Mute Message
- Subscribe to RSS Feed
- Permalink
- Report Inappropriate Content
This seems like you want to annotate based on time. If not then what is it based on?
| makeresults | eval message= "Happy Splunking!!!"
Webinar Recap | Revolutionizing IT Operations: The Transformative Power of AI and ML ...
.conf24 | Registration Open!
ICYMI - Check out the latest releases of Splunk Edge Processor
