- Splunk Answers
- :
- Using Splunk
- :
- Dashboards & Visualizations
- :
- Calculate percentage between two different panels
- Subscribe to RSS Feed
- Mark Topic as New
- Mark Topic as Read
- Float this Topic for Current User
- Bookmark Topic
- Subscribe to Topic
- Mute Topic
- Printer Friendly Page
- Mark as New
- Bookmark Message
- Subscribe to Message
- Mute Message
- Subscribe to RSS Feed
- Permalink
- Report Inappropriate Content
Calculate percentage between two different panels
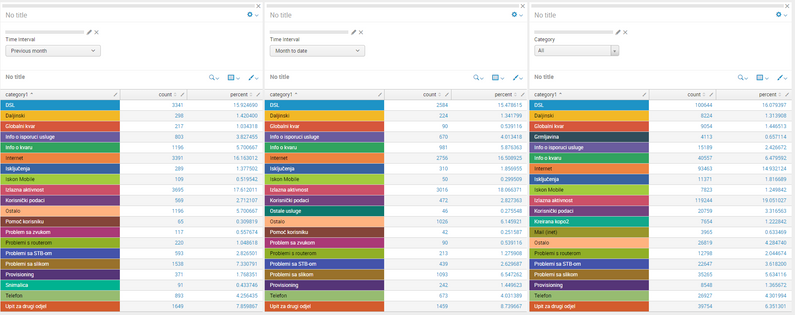
I have a dashboard setup like this.
First panel shows statistics by categories, and you can choose a time interval to display the data. Search code is: index=kopo sourcetype="kopo primjeri" category1 |top limit=20 category1. Time range scope is set with the drop down menu above the table, named time_prev
Second panel basically does the same thing, again you can choose the time interval. Search code is: index=kopo sourcetype="kopo primjeri" category1 |top limit=20 category1. Time range scope is set with the drop down menu above the table, named time_curr
What I'm trying to do is, in the third panel, show percentage difference between the second panel count and first panel count.
- Mark as New
- Bookmark Message
- Subscribe to Message
- Mute Message
- Subscribe to RSS Feed
- Permalink
- Report Inappropriate Content
Hi @sobotiv,
in the third panel you have to use both the searches and calculate and display percentages, but the question is: are you sure that the first 20 results (top 20) of the first panel will be the same of second and third panel?
To do this I hint to create only one search with the contents of all panels and then display in each panel the relative field.
Obviously running the same search in three panels you have to use the Post Process Search.
Ciao.
Giuseppe
- Mark as New
- Bookmark Message
- Subscribe to Message
- Mute Message
- Subscribe to RSS Feed
- Permalink
- Report Inappropriate Content
Hey,
yes, the amount of results is always the same

