Turn on suggestions
Auto-suggest helps you quickly narrow down your search results by suggesting possible matches as you type.
Showing results for
Dashboards & Visualizations
Turn on suggestions
Auto-suggest helps you quickly narrow down your search results by suggesting possible matches as you type.
Showing results for
- Splunk Answers
- :
- Using Splunk
- :
- Dashboards & Visualizations
- :
- Add trendline to timechart splunk
Options
- Subscribe to RSS Feed
- Mark Topic as New
- Mark Topic as Read
- Float this Topic for Current User
- Bookmark Topic
- Subscribe to Topic
- Mute Topic
- Printer Friendly Page
- Mark as New
- Bookmark Message
- Subscribe to Message
- Mute Message
- Subscribe to RSS Feed
- Permalink
- Report Inappropriate Content
karthi25
Path Finder
01-04-2018
04:01 AM
I am having the chart with durations, Now I want add a line over the chart with values as avg(duration). I used below query, but its not showing up trendline
index=cloudfoundry sourcetype=cloudfoundry_apps "cf_foundation=px-npe01" "cf_org_name=Commissions" "cf_space_name=development" "cf_app_name=splunk**   |search endDate !=null AND status='COMPLETED' |eval start_epoch=strptime(startDate,"%Y-%m-%d %H:%M:%S.%1N")
     |eval _time=start_epoch
     |eval end_epoch=strptime(endDate,"%Y-%m-%d %H:%M:%S.%1N")
     |eval duration=round((end_epoch-start_epoch)/3600)
      | chart values(duration) as duration by processLogId | trendline sma5(duration) as sma_Max_Resp
My expectation will be as follows

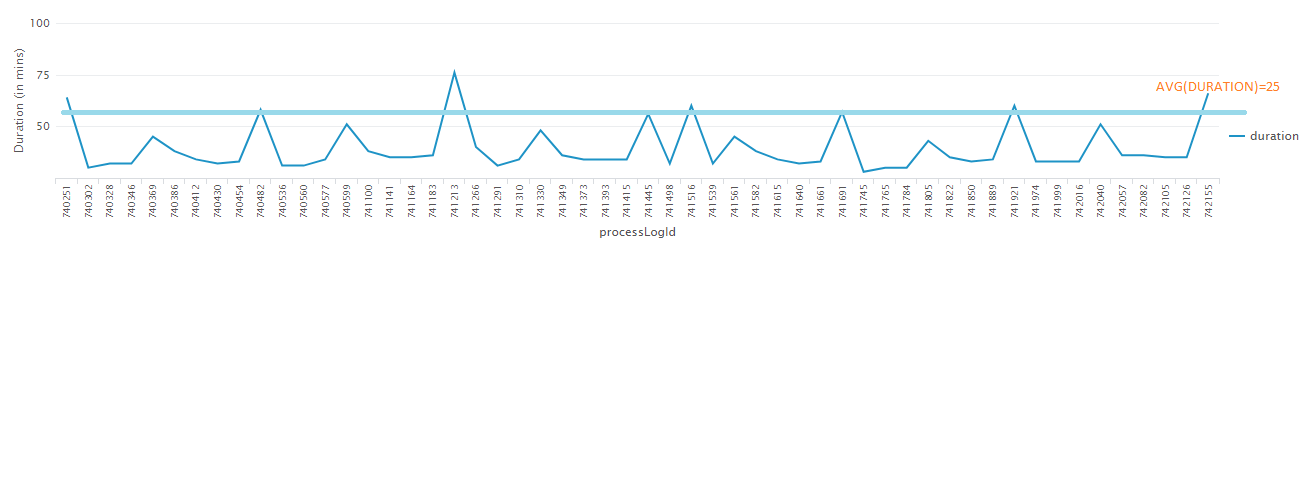
1 Solution
- Mark as New
- Bookmark Message
- Subscribe to Message
- Mute Message
- Subscribe to RSS Feed
- Permalink
- Report Inappropriate Content
mayurr98
Super Champion
01-04-2018
04:43 AM
hey try this!
index=cloudfoundry sourcetype=cloudfoundry_apps "cf_foundation=px-npe01" "cf_org_name=Commissions" "cf_space_name=development" "cf_app_name=splunk**
|search endDate !=null AND status='COMPLETED' |eval start_epoch=strptime(startDate,"%Y-%m-%d %H:%M:%S.%1N")
      |eval _time=start_epoch
      |eval end_epoch=strptime(endDate,"%Y-%m-%d %H:%M:%S.%1N")
      |eval duration=round((end_epoch-start_epoch)/3600)
       | chart values(duration) as duration by processLogId | eventstats avg(duration) as avg_duration
just add eventstats avg(duration) as avg_duration at the end of your query instead of trendline command.
let me know if this helps you!
- Mark as New
- Bookmark Message
- Subscribe to Message
- Mute Message
- Subscribe to RSS Feed
- Permalink
- Report Inappropriate Content
karthi25
Path Finder
01-05-2018
03:22 AM
@mayurr98 if I want a line in a column chart.. What can I do?? I tried changing the chart type but that average is in a bar shape not a line
- Mark as New
- Bookmark Message
- Subscribe to Message
- Mute Message
- Subscribe to RSS Feed
- Permalink
- Report Inappropriate Content
mayurr98
Super Champion
01-05-2018
03:39 AM
as per my knowledge, it will not create a line in column chart this solution is only meant for line chart!
Get Updates on the Splunk Community!
Routing logs with Splunk OTel Collector for Kubernetes
The Splunk Distribution of the OpenTelemetry (OTel) Collector is a product that provides a way to ingest ...
Welcome to the Splunk Community!
(view in My Videos)
We're so glad you're here!
The Splunk Community is place to connect, learn, give back, and ...
Tech Talk | Elevating Digital Service Excellence: The Synergy of Splunk RUM & APM
Elevating Digital Service Excellence: The Synergy of Real User Monitoring and Application Performance ...
