Turn on suggestions
Auto-suggest helps you quickly narrow down your search results by suggesting possible matches as you type.
Showing results for
Dashboards & Visualizations
Turn on suggestions
Auto-suggest helps you quickly narrow down your search results by suggesting possible matches as you type.
Showing results for
- Splunk Answers
- :
- Using Splunk
- :
- Dashboards & Visualizations
- :
- Add trendline to timechart splunk
Options
- Subscribe to RSS Feed
- Mark Topic as New
- Mark Topic as Read
- Float this Topic for Current User
- Bookmark Topic
- Subscribe to Topic
- Mute Topic
- Printer Friendly Page
- Mark as New
- Bookmark Message
- Subscribe to Message
- Mute Message
- Subscribe to RSS Feed
- Permalink
- Report Inappropriate Content
karthi25
Path Finder
01-04-2018
04:01 AM
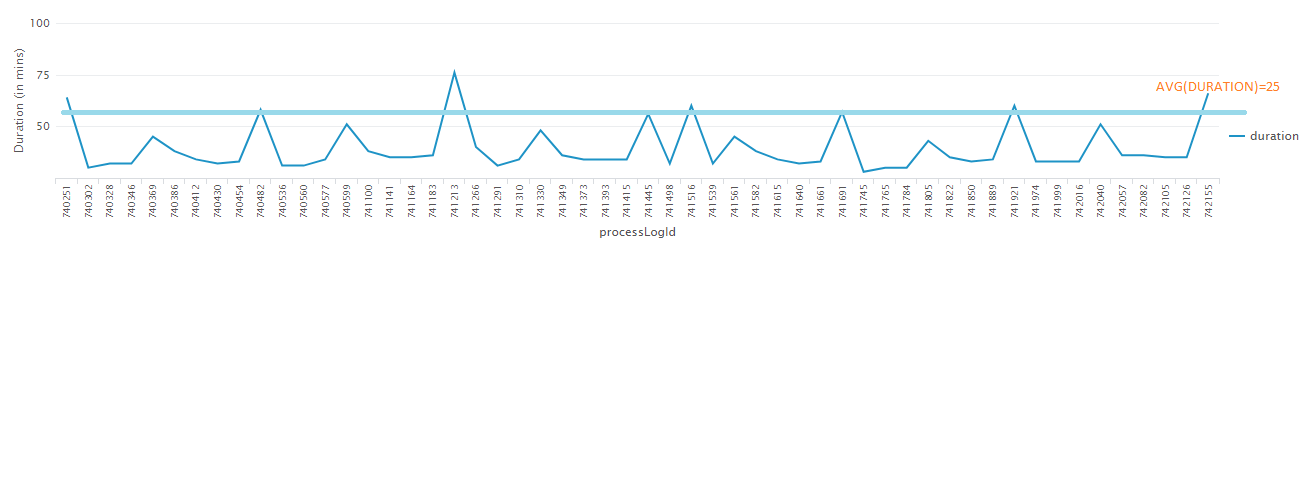
I am having the chart with durations, Now I want add a line over the chart with values as avg(duration). I used below query, but its not showing up trendline
index=cloudfoundry sourcetype=cloudfoundry_apps "cf_foundation=px-npe01" "cf_org_name=Commissions" "cf_space_name=development" "cf_app_name=splunk**   |search endDate !=null AND status='COMPLETED' |eval start_epoch=strptime(startDate,"%Y-%m-%d %H:%M:%S.%1N")
     |eval _time=start_epoch
     |eval end_epoch=strptime(endDate,"%Y-%m-%d %H:%M:%S.%1N")
     |eval duration=round((end_epoch-start_epoch)/3600)
      | chart values(duration) as duration by processLogId | trendline sma5(duration) as sma_Max_Resp
My expectation will be as follows

1 Solution
- Mark as New
- Bookmark Message
- Subscribe to Message
- Mute Message
- Subscribe to RSS Feed
- Permalink
- Report Inappropriate Content
mayurr98
Super Champion
01-04-2018
04:43 AM
hey try this!
index=cloudfoundry sourcetype=cloudfoundry_apps "cf_foundation=px-npe01" "cf_org_name=Commissions" "cf_space_name=development" "cf_app_name=splunk**
|search endDate !=null AND status='COMPLETED' |eval start_epoch=strptime(startDate,"%Y-%m-%d %H:%M:%S.%1N")
      |eval _time=start_epoch
      |eval end_epoch=strptime(endDate,"%Y-%m-%d %H:%M:%S.%1N")
      |eval duration=round((end_epoch-start_epoch)/3600)
       | chart values(duration) as duration by processLogId | eventstats avg(duration) as avg_duration
just add eventstats avg(duration) as avg_duration at the end of your query instead of trendline command.
let me know if this helps you!
- Mark as New
- Bookmark Message
- Subscribe to Message
- Mute Message
- Subscribe to RSS Feed
- Permalink
- Report Inappropriate Content
karthi25
Path Finder
01-05-2018
03:22 AM
@mayurr98 if I want a line in a column chart.. What can I do?? I tried changing the chart type but that average is in a bar shape not a line
- Mark as New
- Bookmark Message
- Subscribe to Message
- Mute Message
- Subscribe to RSS Feed
- Permalink
- Report Inappropriate Content
mayurr98
Super Champion
01-05-2018
03:39 AM
as per my knowledge, it will not create a line in column chart this solution is only meant for line chart!
Get Updates on the Splunk Community!
Webinar Recap | Revolutionizing IT Operations: The Transformative Power of AI and ML ...
The Transformative Power of AI and ML in Enhancing Observability
In the realm of IT operations, the ...
.conf24 | Registration Open!
Hello, hello! I come bearing good news: Registration for .conf24 is now open!
conf is Splunk’s rad annual ...
ICYMI - Check out the latest releases of Splunk Edge Processor
Splunk is pleased to announce the latest enhancements to Splunk Edge Processor.
HEC Receiver authorization ...
