- Splunk Answers
- :
- Using Splunk
- :
- Dashboards & Visualizations
- :
- Re: 任意の1ヶ月間のログ件数をカウントしたい
- Subscribe to RSS Feed
- Mark Topic as New
- Mark Topic as Read
- Float this Topic for Current User
- Bookmark Topic
- Subscribe to Topic
- Mute Topic
- Printer Friendly Page
- Mark as New
- Bookmark Message
- Subscribe to Message
- Mute Message
- Subscribe to RSS Feed
- Permalink
- Report Inappropriate Content
現在ダッシュボードを初めて作製しています。
そこでテキストボックスを作成し、任意の日付を入れられるようにしました。
このダッシュボードではテキストボックスの日付を見て、1ヶ月間のデータ件数をカウントするようにしたいのですが、想定通りの結果になりません。
いろいろ調べていますが、任意の1ヶ月間を指定する方法が分からず困っています。
- Mark as New
- Bookmark Message
- Subscribe to Message
- Mute Message
- Subscribe to RSS Feed
- Permalink
- Report Inappropriate Content
to4kawaさんのコメントのように幾つか入力の仕方に方法がありますので、以下の例がベストかどうかは判断いただければとおもいますが、ご参考までにサンプルを。
そこでテキストボックスを作成し、任意の日付を入れられるようにしました。
質問中の上をそのままやってみると、以下のような感じになりました。イメージあっていればいいですが、いかがでしょうか。
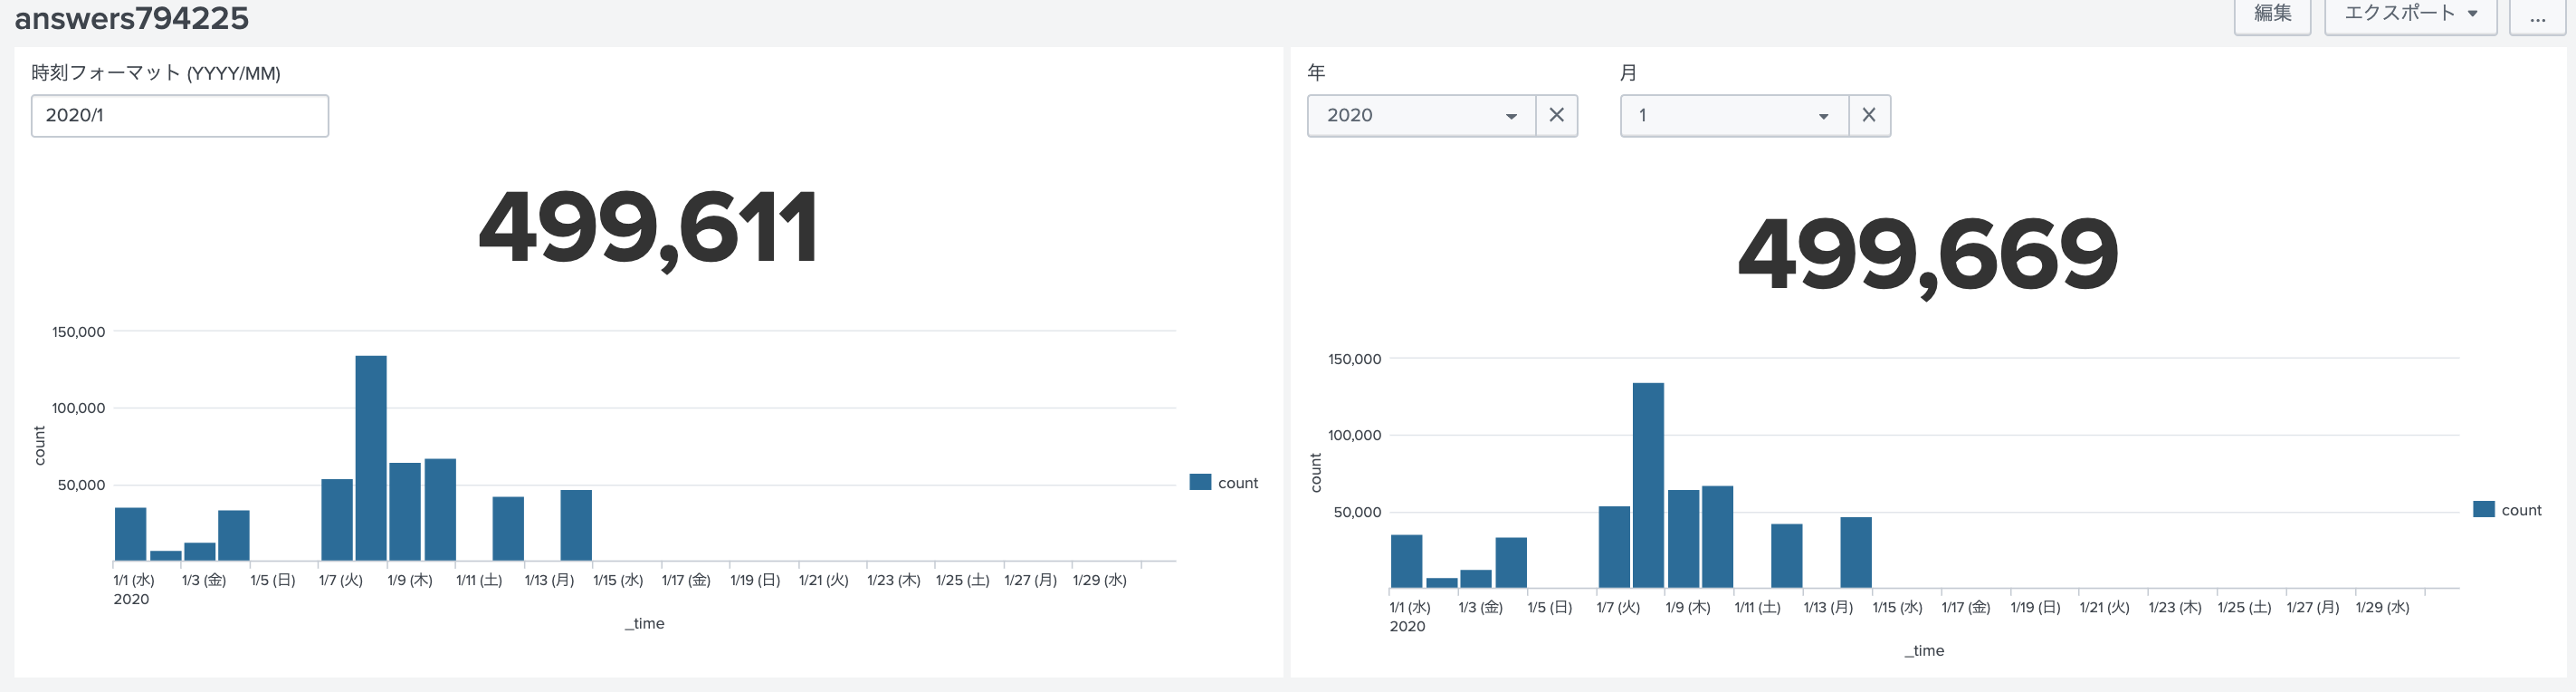
上のテキストボックス用のトークン名をtime1と定義
time1の日付文字をそれぞれearliest(月の初めの時刻)とlatest(翌月のはじめの時刻)として変換
[]でくくられたサブサーチから、earliestとlatestが返されて、メインのサーチの検索時間範囲として利用
index=_internal
[
  | makeresults
  | eval earliest=relative_time(strptime("$time1$", "%Y-%m-%d"),"@mon"), latest=relative_time(strptime("$time1$", "%Y-%m-%d"),"+1mon@mon")
  | fields earliest latest
]
| stats count
実際のダッシュボードのXMLはこちら。
<form>
  <label>answers794225</label>
  <fieldset submitButton="false" autoRun="false"></fieldset>
  <row>
    <panel>
      <input type="text" token="time1" searchWhenChanged="false">
        <label>時刻フォーマット (YYYY/MM)</label>
      </input>
      <single>
        <search>
          <query>
index=_internal
[
  | makeresults
  | eval earliest=relative_time(strptime("$time1$/01", "%Y/%m/%d"),"@mon"), latest=relative_time(strptime("$time1$/01", "%Y/%m/%d"),"+1mon@mon")
  | fields earliest latest
]
| stats count
          </query>
        </search>
      </single>
      <chart>
        <search>
          <query>
| tstats prestats=true count where index=_internal
[
  | makeresults
  | eval earliest=relative_time(strptime("$time1$/01", "%Y/%m/%d"),"@mon"), latest=relative_time(strptime("$time1$/01", "%Y/%m/%d"),"+1mon@mon")
  | return earliest=$$earliest latest=$$latest
] by _time
| timechart count
          </query>
        </search>
        <option name="charting.chart">column</option>
        <option name="charting.drilldown">none</option>
        <option name="refresh.display">progressbar</option>
      </chart>
    </panel>
    <panel>
      <input type="dropdown" token="yyyy">
        <label>Year</label>
        <fieldForLabel>y</fieldForLabel>
        <fieldForValue>y</fieldForValue>
        <search>
          <query>
| makeresults count=30
| streamstats c
| eval y=tonumber(strftime(now(), "%Y"))-c+1
          </query>
        </search>
      </input>
      <input type="dropdown" token="mm">
        <label>Month</label>
        <fieldForLabel>c</fieldForLabel>
        <fieldForValue>c</fieldForValue>
        <search>
          <query>
| makeresults count=12
| streamstats c
          </query>
        </search>
      </input>

      <single>
        <search>
          <query>
index=_internal
[
  | makeresults
  | eval earliest=relative_time(strptime("$yyyy$/$mm$/01", "%Y/%m/%d"),"@mon"), latest=relative_time(strptime("$yyyy$/$mm$/01", "%Y/%m/%d"),"+1mon@mon")
  | fields earliest latest
]
| stats count
          </query>
        </search>
      </single>
      <chart>
        <search>
          <query>
| tstats prestats=true count where index=_internal
[
  | makeresults
  | eval earliest=relative_time(strptime("$yyyy$/$mm$/01", "%Y/%m/%d"),"@mon"), latest=relative_time(strptime("$yyyy$/$mm$/01", "%Y/%m/%d"),"+1mon@mon")
  | return earliest=$$earliest latest=$$latest
] by _time
| timechart count
          </query>
        </search>
        <option name="charting.chart">column</option>
        <option name="charting.drilldown">none</option>
        <option name="refresh.display">progressbar</option>
      </chart>
    </panel>
  </row>
</form>
どうでしょ。
*完成したダッシュボードなど共有いただけると他の皆さんの参考になるかとおもいますので、ご検討いただければ!
- Mark as New
- Bookmark Message
- Subscribe to Message
- Mute Message
- Subscribe to RSS Feed
- Permalink
- Report Inappropriate Content
<form>
  <label>select year and month</label>
  <search id="base">
    <query>| tstats count prestats=t where index=_internal by _time span=1mon
| timechart count span=1mon
| eval year_mon=strftime(_time,"%Y%m")</query>
    <earliest>0</earliest>
    <latest></latest>
  </search>
  <fieldset submitButton="false">
    <input type="dropdown" token="date">
      <label>select year and month</label>
      <fieldForLabel>year_mon</fieldForLabel>
      <fieldForValue>year_mon</fieldForValue>
      <default>year_mon</default>
      <search>
        <query>| metadata type=sourcetypes index=_internal
| stats min(firstTime) as time
| appendpipe
    [eval time=now()]
    | makecontinuous span=1mon time
    | rename time as _time
    | timechart span=1mon count
    | eval year_mon=strftime(_time,"%Y%m")</query>
        <earliest>0</earliest>
        <latest></latest>
      </search>
    </input>
  </fieldset>
  <row>
    <panel>
      <title>Index=_internal</title>
      <single>
        <search base="base">
          <query>| where year_mon=$date$</query>
        </search>
        <option name="drilldown">none</option>
      </single>
    </panel>
  </row>
</form>
@melonman さんがかっこよく作られていますので、私の方は
一ヶ月分ということであれば、選ばせるという方法もあります。
をやってみました。
ログを数えるだけですと、 tstats が使えます。
速い検索ですので、このクエリーのように、ログの最初の期間から検索しても大した時間がかかりません。
なお、選択期間は動的に作成しています。
@clio706 さん
こういったのでどうでしょうか?
- Mark as New
- Bookmark Message
- Subscribe to Message
- Mute Message
- Subscribe to RSS Feed
- Permalink
- Report Inappropriate Content
ありがとうございます!
想定の内容が出来つつあります。
いろいろと試してみたいと思います。
- Mark as New
- Bookmark Message
- Subscribe to Message
- Mute Message
- Subscribe to RSS Feed
- Permalink
- Report Inappropriate Content
to4kawaさんのコメントのように幾つか入力の仕方に方法がありますので、以下の例がベストかどうかは判断いただければとおもいますが、ご参考までにサンプルを。
そこでテキストボックスを作成し、任意の日付を入れられるようにしました。
質問中の上をそのままやってみると、以下のような感じになりました。イメージあっていればいいですが、いかがでしょうか。
上のテキストボックス用のトークン名をtime1と定義
time1の日付文字をそれぞれearliest(月の初めの時刻)とlatest(翌月のはじめの時刻)として変換
[]でくくられたサブサーチから、earliestとlatestが返されて、メインのサーチの検索時間範囲として利用
index=_internal
[
  | makeresults
  | eval earliest=relative_time(strptime("$time1$", "%Y-%m-%d"),"@mon"), latest=relative_time(strptime("$time1$", "%Y-%m-%d"),"+1mon@mon")
  | fields earliest latest
]
| stats count
実際のダッシュボードのXMLはこちら。
<form>
  <label>answers794225</label>
  <fieldset submitButton="false" autoRun="false"></fieldset>
  <row>
    <panel>
      <input type="text" token="time1" searchWhenChanged="false">
        <label>時刻フォーマット (YYYY/MM)</label>
      </input>
      <single>
        <search>
          <query>
index=_internal
[
  | makeresults
  | eval earliest=relative_time(strptime("$time1$/01", "%Y/%m/%d"),"@mon"), latest=relative_time(strptime("$time1$/01", "%Y/%m/%d"),"+1mon@mon")
  | fields earliest latest
]
| stats count
          </query>
        </search>
      </single>
      <chart>
        <search>
          <query>
| tstats prestats=true count where index=_internal
[
  | makeresults
  | eval earliest=relative_time(strptime("$time1$/01", "%Y/%m/%d"),"@mon"), latest=relative_time(strptime("$time1$/01", "%Y/%m/%d"),"+1mon@mon")
  | return earliest=$$earliest latest=$$latest
] by _time
| timechart count
          </query>
        </search>
        <option name="charting.chart">column</option>
        <option name="charting.drilldown">none</option>
        <option name="refresh.display">progressbar</option>
      </chart>
    </panel>
    <panel>
      <input type="dropdown" token="yyyy">
        <label>Year</label>
        <fieldForLabel>y</fieldForLabel>
        <fieldForValue>y</fieldForValue>
        <search>
          <query>
| makeresults count=30
| streamstats c
| eval y=tonumber(strftime(now(), "%Y"))-c+1
          </query>
        </search>
      </input>
      <input type="dropdown" token="mm">
        <label>Month</label>
        <fieldForLabel>c</fieldForLabel>
        <fieldForValue>c</fieldForValue>
        <search>
          <query>
| makeresults count=12
| streamstats c
          </query>
        </search>
      </input>

      <single>
        <search>
          <query>
index=_internal
[
  | makeresults
  | eval earliest=relative_time(strptime("$yyyy$/$mm$/01", "%Y/%m/%d"),"@mon"), latest=relative_time(strptime("$yyyy$/$mm$/01", "%Y/%m/%d"),"+1mon@mon")
  | fields earliest latest
]
| stats count
          </query>
        </search>
      </single>
      <chart>
        <search>
          <query>
| tstats prestats=true count where index=_internal
[
  | makeresults
  | eval earliest=relative_time(strptime("$yyyy$/$mm$/01", "%Y/%m/%d"),"@mon"), latest=relative_time(strptime("$yyyy$/$mm$/01", "%Y/%m/%d"),"+1mon@mon")
  | return earliest=$$earliest latest=$$latest
] by _time
| timechart count
          </query>
        </search>
        <option name="charting.chart">column</option>
        <option name="charting.drilldown">none</option>
        <option name="refresh.display">progressbar</option>
      </chart>
    </panel>
  </row>
</form>
どうでしょ。
*完成したダッシュボードなど共有いただけると他の皆さんの参考になるかとおもいますので、ご検討いただければ!
- Mark as New
- Bookmark Message
- Subscribe to Message
- Mute Message
- Subscribe to RSS Feed
- Permalink
- Report Inappropriate Content
ありがとうございます。
イメージに近いものができつつあります。
ダッシュボードが完成しましたらアップしたいと思います。
- Mark as New
- Bookmark Message
- Subscribe to Message
- Mute Message
- Subscribe to RSS Feed
- Permalink
- Report Inappropriate Content
日付のフォーマットによってやり方が違います
入力する日付はどのような形で入力していますか?
一ヶ月分ということであれば、選ばせるという方法もあります。
- Mark as New
- Bookmark Message
- Subscribe to Message
- Mute Message
- Subscribe to RSS Feed
- Permalink
- Report Inappropriate Content
ありがとうございます。
日付のフォーマットはYYYY/DDを予定しております。
Webinar Recap | Revolutionizing IT Operations: The Transformative Power of AI and ML ...
.conf24 | Registration Open!
ICYMI - Check out the latest releases of Splunk Edge Processor
