- Splunk Answers
- :
- Splunk Administration
- :
- Knowledge Management
- :
- Re: Time taken by multiple events in a distributed...
- Subscribe to RSS Feed
- Mark Topic as New
- Mark Topic as Read
- Float this Topic for Current User
- Bookmark Topic
- Subscribe to Topic
- Mute Topic
- Printer Friendly Page
- Mark as New
- Bookmark Message
- Subscribe to Message
- Mute Message
- Subscribe to RSS Feed
- Permalink
- Report Inappropriate Content
Time taken by multiple events in a distributed transaction
Hi , we have a audit log with the information of different event types and their execution time for different customers.
Something like checkout event is parent event and inside that there are many different events like apply coupon event, validate card event , make payments event etc . These events vary for each customer. Check out event execution time includes our execution time and also other child event execution times.
I am trying to create a pie chart which shows time taken by each event . In order to do that I need to get the total time taken for the check out event minus time taken by other child events for each customer then group by event type . I am not sure how to do this one in Splunk . I am able to group by event type , not able to include customer id .
Any help is really appreciated.
- Mark as New
- Bookmark Message
- Subscribe to Message
- Mute Message
- Subscribe to RSS Feed
- Permalink
- Report Inappropriate Content
hello there,
i uploaded your data to my dev splunk and added more events to add some color
here is the data i uploaded / indexed:
{"StreamMessageContext":{"EventStreamData":{"eventName":"MyApplicationEvent","requestContext":{"request":{"present":true},"responseData":{"partialContent":false,"applicationName":"example-application-app","allRequestHeaders":{"accept":["application/json;v=3"],"client-correlation-id":["123456"],"args":{"isRealTimeEligible":true,"applicationId":"1020304050607080"},"eventContext":{"startTime":"2019-04-25 14:47:42.176 +00:00","endTime":"2019-04-25 14:47:42.202 +00:00","executionTimeInMs":66}}}}}}}
{"StreamMessageContext":{"EventStreamData":{"eventName":"DownStreamServiceEvent1","requestContext":{"request":{"present":true},"responseData":{"partialContent":false,"applicationName":"example-application-app","allRequestHeaders":{"accept":["application/json;v=3"],"client-correlation-id":["123456"],"args":{"isRealTimeEligible":true,"applicationId":"1020304050607080"},"eventContext":{"startTime":"2019-04-25 14:47:42.176 +00:00","endTime":"2019-04-25 14:47:42.202 +00:00","executionTimeInMs":26}}}}}}}
{"StreamMessageContext":{"EventStreamData":{"eventName":"DownStreamServiceEvent2","requestContext":{"request":{"present":true},"responseData":{"partialContent":false,"applicationName":"example-application-app","allRequestHeaders":{"accept":["application/json;v=3"],"client-correlation-id":["123456"],"args":{"isRealTimeEligible":true,"applicationId":"1020304050607080"},"eventContext":{"startTime":"2019-04-25 14:47:42.176 +00:00","endTime":"2019-04-25 14:47:42.202 +00:00","executionTimeInMs":16}}}}}}}
{"StreamMessageContext":{"EventStreamData":{"eventName":"DownStreamServiceEvent3","requestContext":{"request":{"present":true},"responseData":{"partialContent":false,"applicationName":"example-application-app","allRequestHeaders":{"accept":["application/json;v=3"],"client-correlation-id":["123456"],"args":{"isRealTimeEligible":true,"applicationId":"1020304050607080"},"eventContext":{"startTime":"2019-04-25 14:47:42.176 +00:00","endTime":"2019-04-25 14:47:42.202 +00:00","executionTimeInMs":14}}}}}}}
{"StreamMessageContext":{"EventStreamData":{"eventName":"MyApplicationEvent","requestContext":{"request":{"present":true},"responseData":{"partialContent":false,"applicationName":"example-application-app","allRequestHeaders":{"accept":["application/json;v=3"],"client-correlation-id":["123456"],"args":{"isRealTimeEligible":true,"applicationId":"1020304050607081"},"eventContext":{"startTime":"2019-04-25 14:49:42.176 +00:00","endTime":"2019-04-25 14:49:42.302 +00:00","executionTimeInMs":126}}}}}}}
{"StreamMessageContext":{"EventStreamData":{"eventName":"DownStreamServiceEvent1","requestContext":{"request":{"present":true},"responseData":{"partialContent":false,"applicationName":"example-application-app","allRequestHeaders":{"accept":["application/json;v=3"],"client-correlation-id":["123456"],"args":{"isRealTimeEligible":true,"applicationId":"1020304050607081"},"eventContext":{"startTime":"2019-04-25 14:49:42.176 +00:00","endTime":"2019-04-25 14:49:42.302 +00:00","executionTimeInMs":45}}}}}}}
{"StreamMessageContext":{"EventStreamData":{"eventName":"DownStreamServiceEvent2","requestContext":{"request":{"present":true},"responseData":{"partialContent":false,"applicationName":"example-application-app","allRequestHeaders":{"accept":["application/json;v=3"],"client-correlation-id":["123456"],"args":{"isRealTimeEligible":true,"applicationId":"1020304050607081"},"eventContext":{"startTime":"2019-04-25 14:49:42.176 +00:00","endTime":"2019-04-25 14:49:42.302 +00:00","executionTimeInMs":11}}}}}}}
{"StreamMessageContext":{"EventStreamData":{"eventName":"DownStreamServiceEvent3","requestContext":{"request":{"present":true},"responseData":{"partialContent":false,"applicationName":"example-application-app","allRequestHeaders":{"accept":["application/json;v=3"],"client-correlation-id":["123456"],"args":{"isRealTimeEligible":true,"applicationId":"1020304050607081"},"eventContext":{"startTime":"2019-04-25 14:49:42.176 +00:00","endTime":"2019-04-25 14:49:42.302 +00:00","executionTimeInMs":17}}}}}}}
used prebuilt _JSON sourcetype and indexed to the "default" index
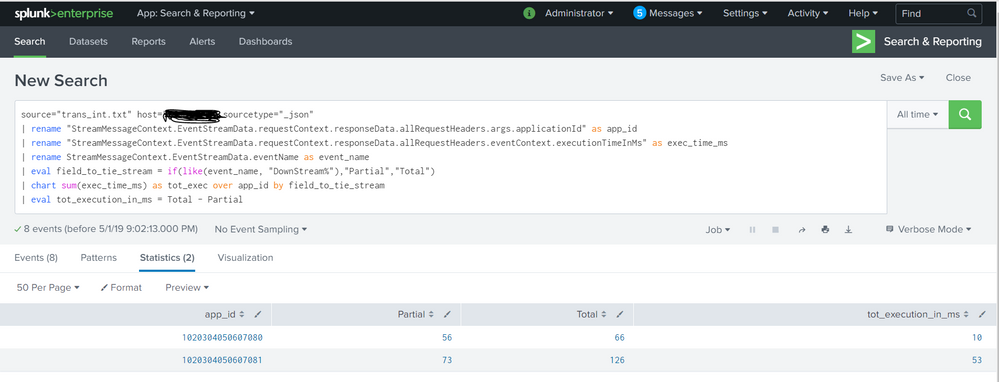
here is my search: (note, i used rename to shorten field names but you dont have to)
index=main sourcetype="_json"
| rename "StreamMessageContext.EventStreamData.requestContext.responseData.allRequestHeaders.args.applicationId" as app_id
| rename "StreamMessageContext.EventStreamData.requestContext.responseData.allRequestHeaders.eventContext.executionTimeInMs" as exec_time_ms
| rename StreamMessageContext.EventStreamData.eventName as event_name
| eval field_to_tie_stream = if(like(event_name, "DownStream%"),"Partial","Total")
| chart sum(exec_time_ms) as tot_exec over app_id by field_to_tie_stream
| eval tot_execution_in_ms = Total - Partial
here is a screenshot
hope it helps
- Mark as New
- Bookmark Message
- Subscribe to Message
- Mute Message
- Subscribe to RSS Feed
- Permalink
- Report Inappropriate Content
Hi sathishthangaraj,
if I correctly undestood, you want to bucketize your values and display in a pie e.g. the first ten values, correct?
To do this you should run something like this (in this example I divide into time buckets of ten minutes and i have execution_time expressed in seconds):
my_search execution_time=*
| bin execution_time span=10
| stats count BY execution_time
| head 10
Bye.
Giuseppe
- Mark as New
- Bookmark Message
- Subscribe to Message
- Mute Message
- Subscribe to RSS Feed
- Permalink
- Report Inappropriate Content
Hi Giuseppe ,
Thanks for your reply . Not exactly .
I am trying to find the execution time of one event by summing up downstream events execution time then calculating the difference between Total Execution Time and DownStreamEvents Execution Time.
DownstreamEventsExecutionTime = SUM (DownStreamEvent1 Execution Time + DownStreamEvent2 execution time ......)
Total Execution Time = MyApplicationEventExecutionTime + DownStreamEventsExecutionTime(from above step)
Then find the difference
difference = Total Execution Time - DownStreamEventsExecutionTime
Then Show everything on the pie chart with different events and their response times.
- Mark as New
- Bookmark Message
- Subscribe to Message
- Mute Message
- Subscribe to RSS Feed
- Permalink
- Report Inappropriate Content
You've named it yourself - transaction. Did you try to build a transaction from the beginning to the end?
When doing that and grouping the transaction around either one or multiple fields, a few fields get calculated, including the duration field (which might be what you want).
After a transaction, you can append another search to filter your events further.
E.g. do a
| transaction field1 field2
| search field3=xyz
to specify what you want. Maybe this helps. If not, I guess we'd need some sample data.
- Mark as New
- Bookmark Message
- Subscribe to Message
- Mute Message
- Subscribe to RSS Feed
- Permalink
- Report Inappropriate Content
index=app_name | transaction EventStreamData.eventName EventStreamData.args.applicationId | stats perc95("EventStreamData.eventContext.executionTimeInMs") by "EventStreamData.eventName"
I have something like this now . How do i ignore few events from the transaction ?
Below is my application event for the application id 1020304050607080 with the execution time of 66 ms
{"StreamMessageContext":{"EventStreamData":{"eventName":"MyApplicationEvent","requestContext":{"request":{"present":true},"responseData":{"partialContent":false,"applicationName":"example-application-app","allRequestHeaders":{"accept":["application/json;v=3"],"client-correlation-id":["123456"],"args":{"isRealTimeEligible":true,"applicationId":"1020304050607080"},"eventContext":{"startTime":"2019-04-25 14:47:42.176 +00:00","endTime":"2019-04-25 14:47:42.202 +00:00","executionTimeInMs":66}}}}}}
For the same application id downstreamevent1 takes 26ms and downstreamevent2 takes 16ms and downstreamevent3 takes 14 ms ( Total DownStream execution time in ms = 26+16+14 = 56 ms )
DownStreamEvent1 (26ms)
{"StreamMessageContext":{"EventStreamData":{"eventName":"DownStreamServiceEvent1","requestContext":{"request":{"present":true},"responseData":{"partialContent":false,"applicationName":"example-application-app","allRequestHeaders":{"accept":["application/json;v=3"],"client-correlation-id":["123456"],"args":{"isRealTimeEligible":true,"applicationId":"1020304050607080"},"eventContext":{"startTime":"2019-04-25 14:47:42.176 +00:00","endTime":"2019-04-25 14:47:42.202 +00:00","executionTimeInMs":26}}}}}}
DownStreamEvent2 (16ms)
{"StreamMessageContext":{"EventStreamData":{"eventName":"DownStreamServiceEvent2","requestContext":{"request":{"present":true},"responseData":{"partialContent":false,"applicationName":"example-application-app","allRequestHeaders":{"accept":["application/json;v=3"],"client-correlation-id":["123456"],"args":{"isRealTimeEligible":true,"applicationId":"1020304050607080"},"eventContext":{"startTime":"2019-04-25 14:47:42.176 +00:00","endTime":"2019-04-25 14:47:42.202 +00:00","executionTimeInMs":16}}}}}}
DownStreamEvent3 (14ms)
{"StreamMessageContext":{"EventStreamData":{"eventName":"DownStreamServiceEvent3","requestContext":{"request":{"present":true},"responseData":{"partialContent":false,"applicationName":"example-application-app","allRequestHeaders":{"accept":["application/json;v=3"],"client-correlation-id":["123456"],"args":{"isRealTimeEligible":true,"applicationId":"1020304050607080"},"eventContext":{"startTime":"2019-04-25 14:47:42.176 +00:00","endTime":"2019-04-25 14:47:42.202 +00:00","executionTimeInMs":14}}}}}}
DownStreamExecutionTime = 56 ms
MyApplicationExecutionTime = 66ms , my application makes sync calls to different downstream applications. if i reduce downstream response time (66ms - 56ms) , my application code took only 10ms.
I am trying to create a dashboard which shows below details . It should consider all the applicationIds and should shows the average time taken by the each event.
MyApplicationCode Execution Time 10 ms
DownStreamEvent1 Execution Time 26ms
DownStreamEvent2 Execution Time 16ms
DownStreamEvent3 Execution Time 14ms

