- Apps and Add-ons
- :
- All Apps and Add-ons
- :
- Re: Why do some searches only display statistics a...
- Subscribe to RSS Feed
- Mark Topic as New
- Mark Topic as Read
- Float this Topic for Current User
- Bookmark Topic
- Subscribe to Topic
- Mute Topic
- Printer Friendly Page
- Mark as New
- Bookmark Message
- Subscribe to Message
- Mute Message
- Subscribe to RSS Feed
- Permalink
- Report Inappropriate Content
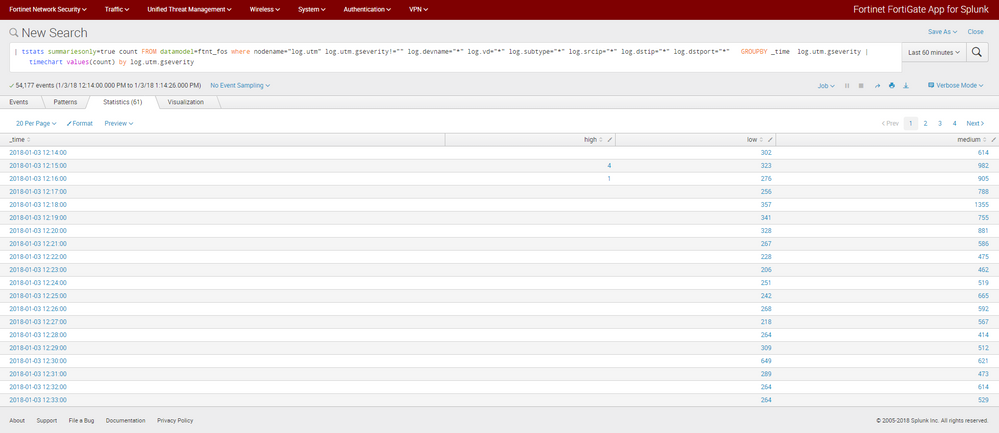
Below is a screen shot from my Fortinet FortiGate App for Splunk. In this case I'm clicking the search "Threat By Severity" on the Threat Dashboard. I noticed that I cannot drill down to events and it's only showing "statistics".
- Mark as New
- Bookmark Message
- Subscribe to Message
- Mute Message
- Subscribe to RSS Feed
- Permalink
- Report Inappropriate Content
The query in your screenshot starts with tstats, a generating command which returns statistical data based on analysis of the tsidx files, not the events themselves. More information about tstats can be found here:
https://docs.splunk.com/Documentation/SplunkCloud/6.6.3/SearchReference/Tstats
This answer also provides some good plain-English explanations of what tstats is:
https://answers.splunk.com/answers/186938/what-is-tstats-and-why-is-so-much-faster-than-stat.html
So basically, Splunk isn't analyzing regular events to generate the data shown on this screenshot, so it hasn't gathered those events for you to view.
- Mark as New
- Bookmark Message
- Subscribe to Message
- Mute Message
- Subscribe to RSS Feed
- Permalink
- Report Inappropriate Content
can you change the drilldown query string from:
    <drilldown>
      <link>
        <![CDATA[
            /app/SplunkAppForFortinet/search?q=`fgt_utm` severity="$click.name2$" earliest=$click.value$ [| stats count | eval latest = $click.value$ %2b 300 | fields latest]
          ]]>
      </link>
    </drilldown>
to following:
    <drilldown>
      <link>
        <![CDATA[
            /app/SplunkAppForFortinet/search?q=| datamodel "ftnt_fos" "utm" search | search log.utm.gseverity="$click.value$"&earliest=$time_token.earliest$&latest=$time_token.latest$
          ]]>
      </link>
    </drilldown>
in this file on your splunk search head:
/opt/splunk/etc/apps/SplunkAppForFortinet/default/data/ui/views/threat_dashboard.xml
- Mark as New
- Bookmark Message
- Subscribe to Message
- Mute Message
- Subscribe to RSS Feed
- Permalink
- Report Inappropriate Content
Thanks for your input I've modified the drilldown as you suggested however I still cannot view the related events from this query.
- Mark as New
- Bookmark Message
- Subscribe to Message
- Mute Message
- Subscribe to RSS Feed
- Permalink
- Report Inappropriate Content
but what did it print out?
- Mark as New
- Bookmark Message
- Subscribe to Message
- Mute Message
- Subscribe to RSS Feed
- Permalink
- Report Inappropriate Content
It appears that it added a "critical column which is nice. I'm hoping you can see the attacked picture below.
https://drive.google.com/file/d/19VPCVdztOH_XNiHV2kXNf8cduj0D5xFA/view?usp=sharing
- Mark as New
- Bookmark Message
- Subscribe to Message
- Mute Message
- Subscribe to RSS Feed
- Permalink
- Report Inappropriate Content
this is not what the query i gave you should show.
maybe you are editing the wrong line.
Line 24 should be the line to be replaced with:
/app/SplunkAppForFortinet/search?q=| datamodel "ftnt_fos" "utm" search | search log.utm.gseverity="$click.value$"&earliest=$time_token.earliest$&latest=$time_token.latest$
- Mark as New
- Bookmark Message
- Subscribe to Message
- Mute Message
- Subscribe to RSS Feed
- Permalink
- Report Inappropriate Content
What I see on line 24 https://drive.google.com/file/d/1lX41MEvqqYkvhn2DTAu6ISGluv8ozPfa/view?usp=sharing
The Code I edited
https://drive.google.com/file/d/1hF2-tk7cNq1dYqwvoSe57rJtB93MSTmc/view?usp=sharing
- Mark as New
- Bookmark Message
- Subscribe to Message
- Mute Message
- Subscribe to RSS Feed
- Permalink
- Report Inappropriate Content
The query in your screenshot starts with tstats, a generating command which returns statistical data based on analysis of the tsidx files, not the events themselves. More information about tstats can be found here:
https://docs.splunk.com/Documentation/SplunkCloud/6.6.3/SearchReference/Tstats
This answer also provides some good plain-English explanations of what tstats is:
https://answers.splunk.com/answers/186938/what-is-tstats-and-why-is-so-much-faster-than-stat.html
So basically, Splunk isn't analyzing regular events to generate the data shown on this screenshot, so it hasn't gathered those events for you to view.
- Mark as New
- Bookmark Message
- Subscribe to Message
- Mute Message
- Subscribe to RSS Feed
- Permalink
- Report Inappropriate Content
"So basically, Splunk isn't analyzing regular events to generate the data shown on this screenshot, so it hasn't gathered those events for you to view. "
Thanks for the explanation of tstats. So the more complicated question would be:
How do I get Splunk to analyze the regular events to generate the data shown?
- Mark as New
- Bookmark Message
- Subscribe to Message
- Mute Message
- Subscribe to RSS Feed
- Permalink
- Report Inappropriate Content
I haven't used the Fortinet app on Splunk, so I'm just making some educated guesses based on the documentation I see on Splunkbase at https://splunkbase.splunk.com/app/2800/#/details
If you followed the default install, it looks like you should be able to find the events that are being used to populate the ftnt_fos data model by searching for sourcetype=fgt_traffic. (I'm basing this guess on step 5 in the documentation, where a screenshot shows a search for this sourcetype.)

