- Apps and Add-ons
- :
- All Apps and Add-ons
- :
- Re: Why am I seeing CPU Usage discrepancy between ...
- Subscribe to RSS Feed
- Mark Topic as New
- Mark Topic as Read
- Float this Topic for Current User
- Bookmark Topic
- Subscribe to Topic
- Mute Topic
- Printer Friendly Page
- Mark as New
- Bookmark Message
- Subscribe to Message
- Mute Message
- Subscribe to RSS Feed
- Permalink
- Report Inappropriate Content
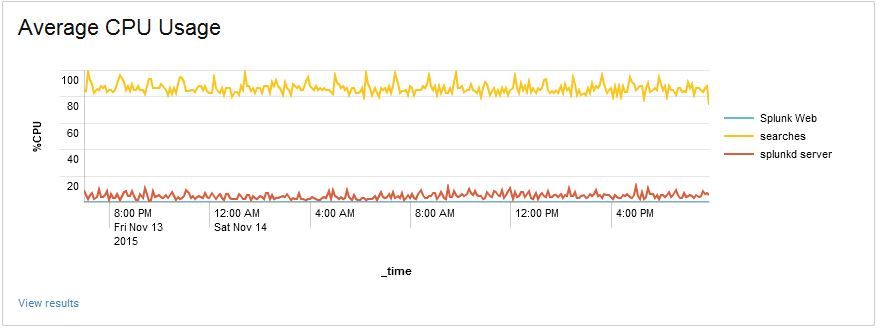
Splunk-on-Splunk (SoS) indicates 80% - 100% CPU usage, due to searches:
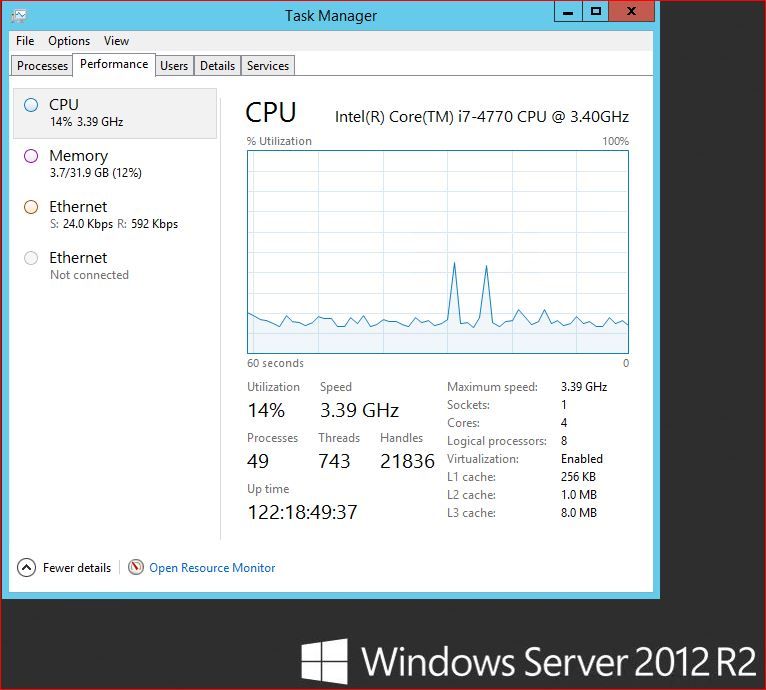
PerfMon indicates about 25% CPU usage:
Why the discrepancy?
- Mark as New
- Bookmark Message
- Subscribe to Message
- Mute Message
- Subscribe to RSS Feed
- Permalink
- Report Inappropriate Content
I'm not sure which perfmon counter you are querying, but my best guess here is that it is a counter that expresses CPU usage as a percentage of the total amount of CPU resources on the system.
In contrast, S.o.S expresses CPU usage per process class (the "searches" class including all search processes) as a percentage of one CPU core.
If my theory is correct, you have a 4-core machine here where one or two searches are running and consuming ~ 1 CPU cores altogether. Therefore, the CPU usage of searches can be expressed as 25% of all CPU resources (1 out of 4 available CPU cores) or ~ 1 CPU core / 100% of 1 CPU core.
Did I guess correctly?
- Mark as New
- Bookmark Message
- Subscribe to Message
- Mute Message
- Subscribe to RSS Feed
- Permalink
- Report Inappropriate Content
You are correct.
Thanks!
Using
[perfmon://CPU Load]
counters = % Processor Time;% User Time
instances = _Total
interval = 10
object = Processor
index = wmi


