Join the Conversation
- Find Answers
- :
- Apps & Add-ons
- :
- All Apps and Add-ons
- :
- All Apps and Add-ons
- :
- Re: Splunk for Nextcloud no data
- Subscribe to RSS Feed
- Mark Topic as New
- Mark Topic as Read
- Float this Topic for Current User
- Bookmark Topic
- Subscribe to Topic
- Mute Topic
- Printer Friendly Page
- Mark as New
- Bookmark Message
- Subscribe to Message
- Mute Message
- Subscribe to RSS Feed
- Permalink
- Report Inappropriate Content
Splunk for Nextcloud no data
Hi! please help us solve the problem of missing data from the Nextcloud server. Splunk was installed and configured according to the instructions. But there is no data in the web interface.
- Mark as New
- Bookmark Message
- Subscribe to Message
- Mute Message
- Subscribe to RSS Feed
- Permalink
- Report Inappropriate Content
Have you checked the indexer queues in the Monitoring Console?
If this reply helps you, Karma would be appreciated.
- Mark as New
- Bookmark Message
- Subscribe to Message
- Mute Message
- Subscribe to RSS Feed
- Permalink
- Report Inappropriate Content
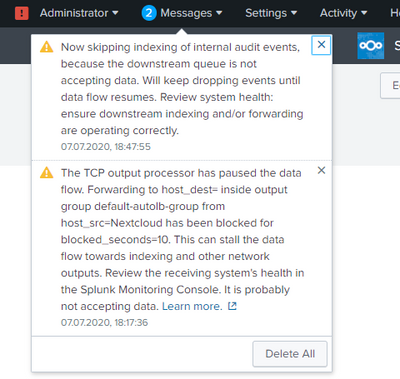
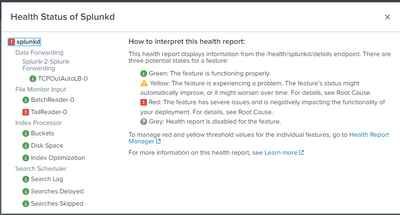
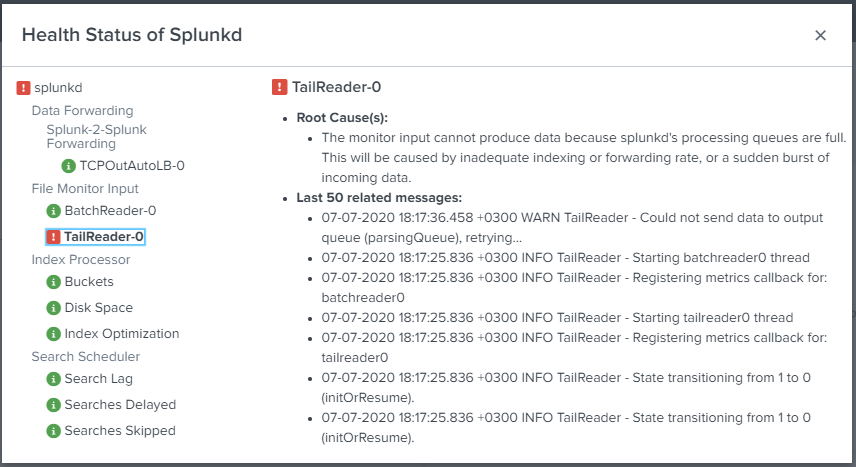
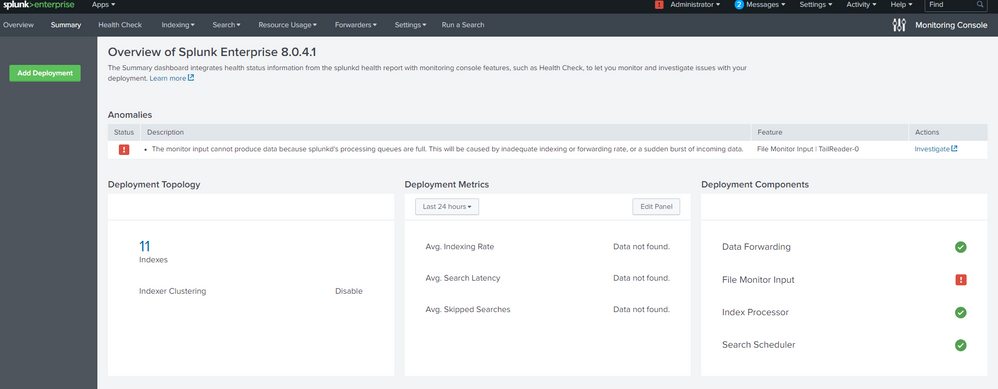
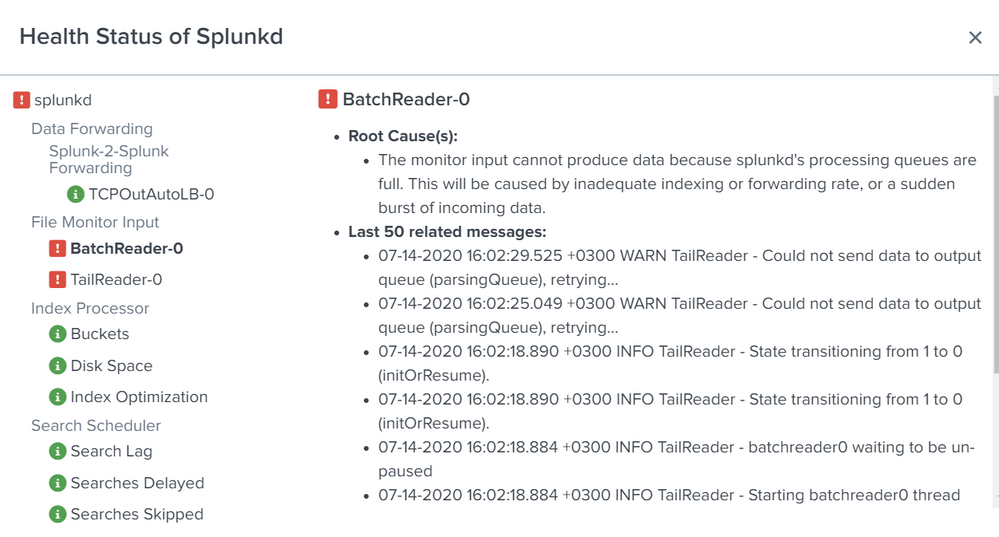
Thanks for the answer! Tell me how to check the status of indexer queues? Warning message " TailReader-0":
- Mark as New
- Bookmark Message
- Subscribe to Message
- Mute Message
- Subscribe to RSS Feed
- Permalink
- Report Inappropriate Content
- Mark as New
- Bookmark Message
- Subscribe to Message
- Mute Message
- Subscribe to RSS Feed
- Permalink
- Report Inappropriate Content
- Mark as New
- Bookmark Message
- Subscribe to Message
- Mute Message
- Subscribe to RSS Feed
- Permalink
- Report Inappropriate Content
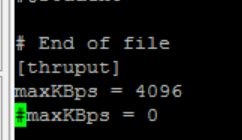
Try increasing the value of maxKBps in limits.conf and restarting the forwarder.
If this reply helps you, Karma would be appreciated.
- Mark as New
- Bookmark Message
- Subscribe to Message
- Mute Message
- Subscribe to RSS Feed
- Permalink
- Report Inappropriate Content
Hello! Thanks for the answer! I set the parameter maxKBps = 4096, but the data is not displayed. Are there any other versions of how you can solve the problem?
- Mark as New
- Bookmark Message
- Subscribe to Message
- Mute Message
- Subscribe to RSS Feed
- Permalink
- Report Inappropriate Content
Tell us more about your Splunk environment. What is the ingestion rate? How many indexers? Are they clustered (it looks like they are not)? How many searches are you running?
Please sign in to an indexer and check the Monitoring Console there. Also, check splunkd.log for errors.
If this reply helps you, Karma would be appreciated.
- Mark as New
- Bookmark Message
- Subscribe to Message
- Mute Message
- Subscribe to RSS Feed
- Permalink
- Report Inappropriate Content
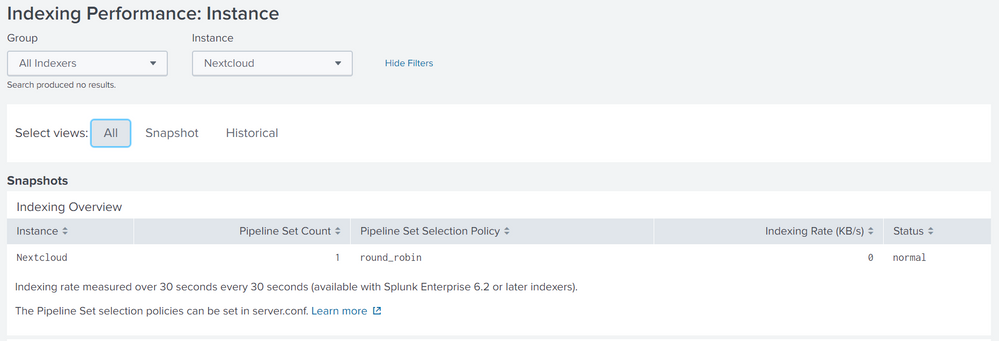
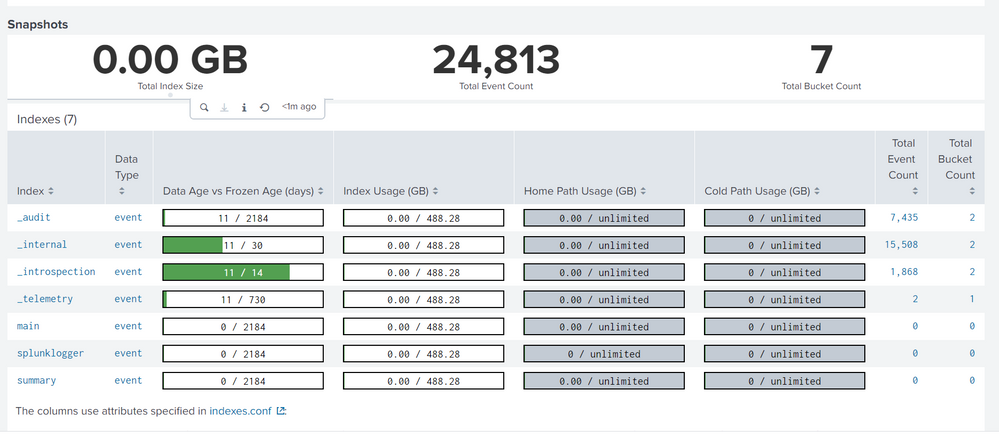
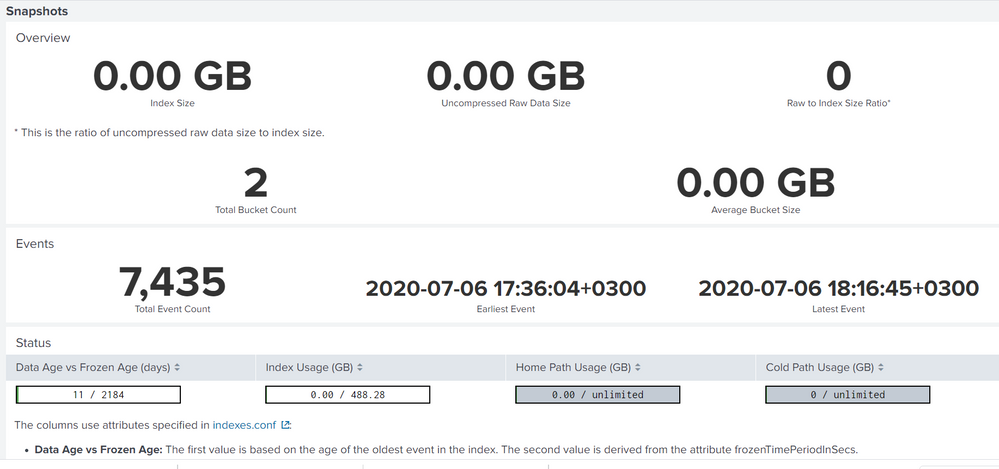
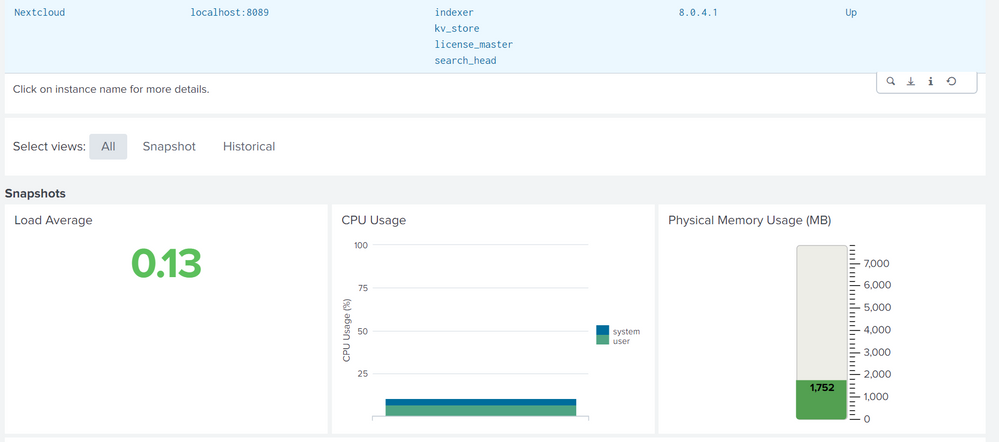
Unfortunately I will not be able to answer all your questions. Splunk is installed on the Nextcloud server according to the instructions, except for this, nothing else has been configured by splunk. When I started splunkforwarder, I got an error that port 8089 is busy and I changed it to 9089. Here is the data from the Monitoring Console and splunk.log. I hope I understood you correctly and sent the necessary data.
https://intranet.graabek.com/cloud/index.php/s/Lc9oXkaWNmQHBqG#pdfviewer
07-17-2020 16:08:35.807 +0300 INFO TcpOutputProc - Removing quarantine from idx=127.0.0.1:9997
07-17-2020 16:08:35.807 +0300 WARN TcpOutputFd - Connect to 127.0.0.1:9997 failed. Connection refused
07-17-2020 16:08:35.807 +0300 ERROR TcpOutputFd - Connection to host=127.0.0.1:9997 failed
07-17-2020 16:08:35.807 +0300 WARN TcpOutputFd - Connect to 127.0.0.1:9997 failed. Connection refused
07-17-2020 16:08:35.807 +0300 ERROR TcpOutputFd - Connection to host=127.0.0.1:9997 failed
07-17-2020 16:08:35.807 +0300 WARN TcpOutputProc - Applying quarantine to ip=127.0.0.1 port=9997 _numberOfFailures=2
07-17-2020 16:09:55.913 +0300 WARN TcpOutputProc - The TCP output processor has paused the data flow. Forwarding to host_dest=127.0.0.1 inside output group default-autolb-group from host_src=Nextcloud has been blocked for blocked_seconds=10600. This can stall the data flow towards indexing and other network outputs. Review the receiving system's health in the Splunk Monitoring Console. It is probably not accepting data.
07-17-2020 16:11:35.926 +0300 WARN TcpOutputProc - The TCP output processor has paused the data flow. Forwarding to host_dest=127.0.0.1 inside output group default-autolb-group from host_src=Nextcloud has been blocked for blocked_seconds=10700. This can stall the data flow towards indexing and other network outputs. Review the receiving system's health in the Splunk Monitoring Console. It is probably not accepting data.
07-17-2020 16:13:15.942 +0300 WARN TcpOutputProc - The TCP output processor has paused the data flow. Forwarding to host_dest=127.0.0.1 inside output group default-autolb-group from host_src=Nextcloud has been blocked for blocked_seconds=10800. This can stall the data flow towards indexing and other network outputs. Review the receiving system's health in the Splunk Monitoring Console. It is probably not accepting data.
07-17-2020 16:14:04.615 +0300 INFO TcpOutputProc - Removing quarantine from idx=127.0.0.1:9997
07-17-2020 16:14:04.616 +0300 WARN TcpOutputFd - Connect to 127.0.0.1:9997 failed. Connection refused
07-17-2020 16:14:04.616 +0300 ERROR TcpOutputFd - Connection to host=127.0.0.1:9997 failed
07-17-2020 16:14:04.616 +0300 WARN TcpOutputFd - Connect to 127.0.0.1:9997 failed. Connection refused
07-17-2020 16:14:04.616 +0300 ERROR TcpOutputFd - Connection to host=127.0.0.1:9997 failed
07-17-2020 16:14:04.616 +0300 WARN TcpOutputProc - Applying quarantine to ip=127.0.0.1 port=9997 _numberOfFailures=2
(END)
- Mark as New
- Bookmark Message
- Subscribe to Message
- Mute Message
- Subscribe to RSS Feed
- Permalink
- Report Inappropriate Content
How did you miss these messages?
07-17-2020 16:08:35.807 +0300 WARN TcpOutputFd - Connect to 127.0.0.1:9997 failed. Connection refused
07-17-2020 16:08:35.807 +0300 ERROR TcpOutputFd - Connection to host=127.0.0.1:9997 failedThis would seem to be the root cause of the problem. Is 9997 the correct port for your indexer? Have you checked your firewalls to verify traffic is allowed to port 9997?
Are you running a forwarder on the same server as another Splunk instance? Don't do that. Splunk can monitor files on the local system without help from a forwarder. This would explain why port 8089 is already in use.
If this reply helps you, Karma would be appreciated.
