- Apps and Add-ons
- :
- All Apps and Add-ons
- :
- Re: Splunk Add-on for Nessu: Why is my search not ...
- Subscribe to RSS Feed
- Mark Topic as New
- Mark Topic as Read
- Float this Topic for Current User
- Bookmark Topic
- Subscribe to Topic
- Mute Topic
- Printer Friendly Page
- Mark as New
- Bookmark Message
- Subscribe to Message
- Mute Message
- Subscribe to RSS Feed
- Permalink
- Report Inappropriate Content
Splunk Add-on for Nessu: Why is my search not retrieving all events from the Nessus scan?
Wondering if anyone else is seeing this problem. I configured the Splunk add-on for Nessus without any problems. I'm able to search for Nessus events in Splunk, however, I'm not seeing all the events I'm expecting to see.
First I ran a host discovery scan in Nessus.
I then ran this search in Splunk to only pull the events from that scan:
sourcetype=nessus:scan name = "Host discovery scan"
The Nessus scan discovered 294 hosts, yet the Splunk search only returned 248 hosts. I've racked my brains trying to figure out why but came up short. Any ideas what could be happening here?
- Mark as New
- Bookmark Message
- Subscribe to Message
- Mute Message
- Subscribe to RSS Feed
- Permalink
- Report Inappropriate Content
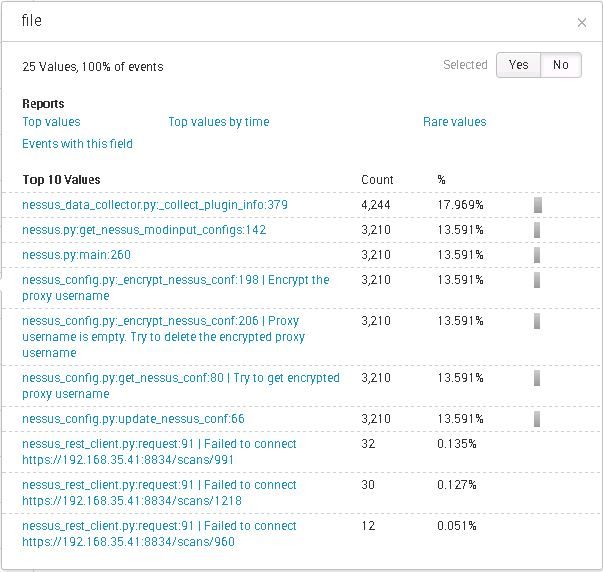
What do you see in the add-on's logs? http://docs.splunk.com/Documentation/AddOns/latest/Nessus/Troubleshoot
- Mark as New
- Bookmark Message
- Subscribe to Message
- Mute Message
- Subscribe to RSS Feed
- Permalink
- Report Inappropriate Content
- Mark as New
- Bookmark Message
- Subscribe to Message
- Mute Message
- Subscribe to RSS Feed
- Permalink
- Report Inappropriate Content
Is there a chance that some of the events in splunk don't have a value in the "name" field?
Is your search timeframe (4 hours) the same as the timeframe covered by the scan, i.e. same start and end time (and are the timezone settings the same?)?
What values do you get when you run sourcetype=nessus:scan | stats values(name)?
- Mark as New
- Bookmark Message
- Subscribe to Message
- Mute Message
- Subscribe to RSS Feed
- Permalink
- Report Inappropriate Content
Is there a chance that some of the events in splunk don't have a value in the "name" field? I don't see how that's possible. Also if I do this search sourcetype=nessus:scan I get the same results so the name field can't be the issue.
Is your search timeframe (4 hours) the same as the timeframe covered by the scan, i.e. same start and end time (and are the timezone settings the same?)? Yes, the Nessus scan was run on 2/1 at 4:50 PM and completed in 38 minutes. You can see in the image above that my Splunk time frame is well within the Nessus time frame.
What values do you get when you run sourcetype=nessus:scan | stats values(name)? I ran my exact same search today and now I'm only getting 3 events. Maddening! I ran your search and got the same 3 events.
It's looking to me like the add-on is jacked up.


